You can use breakdowns to split up trends insights by the values of a specific property, such as by Current URL, Country, or email, or a cohort of users – pretty much anything you can imagine, really.
To add a breakdown, click on '+ Add breakdown' in the group filters section and search for your desired property. The supported properties are:
| Name | Description |
|---|---|
| Event properties | Properties specific to a tracked event (e.g. Current URL) |
| Session properties | Properties specific to a single session (e.g. Entry URL) |
| Person properties | Properties stored on a user's person profile (e.g. company_name) |
| Feature flag | Events where a specific feature flag was enabled |
| Group properties | Properties stored on a group (requires group analytics) |
| Cohorts | Events performed by a pre-defined list of users |
| HogQL | Custom breakdown using SQL (see our advanced breakdowns tutorial) |
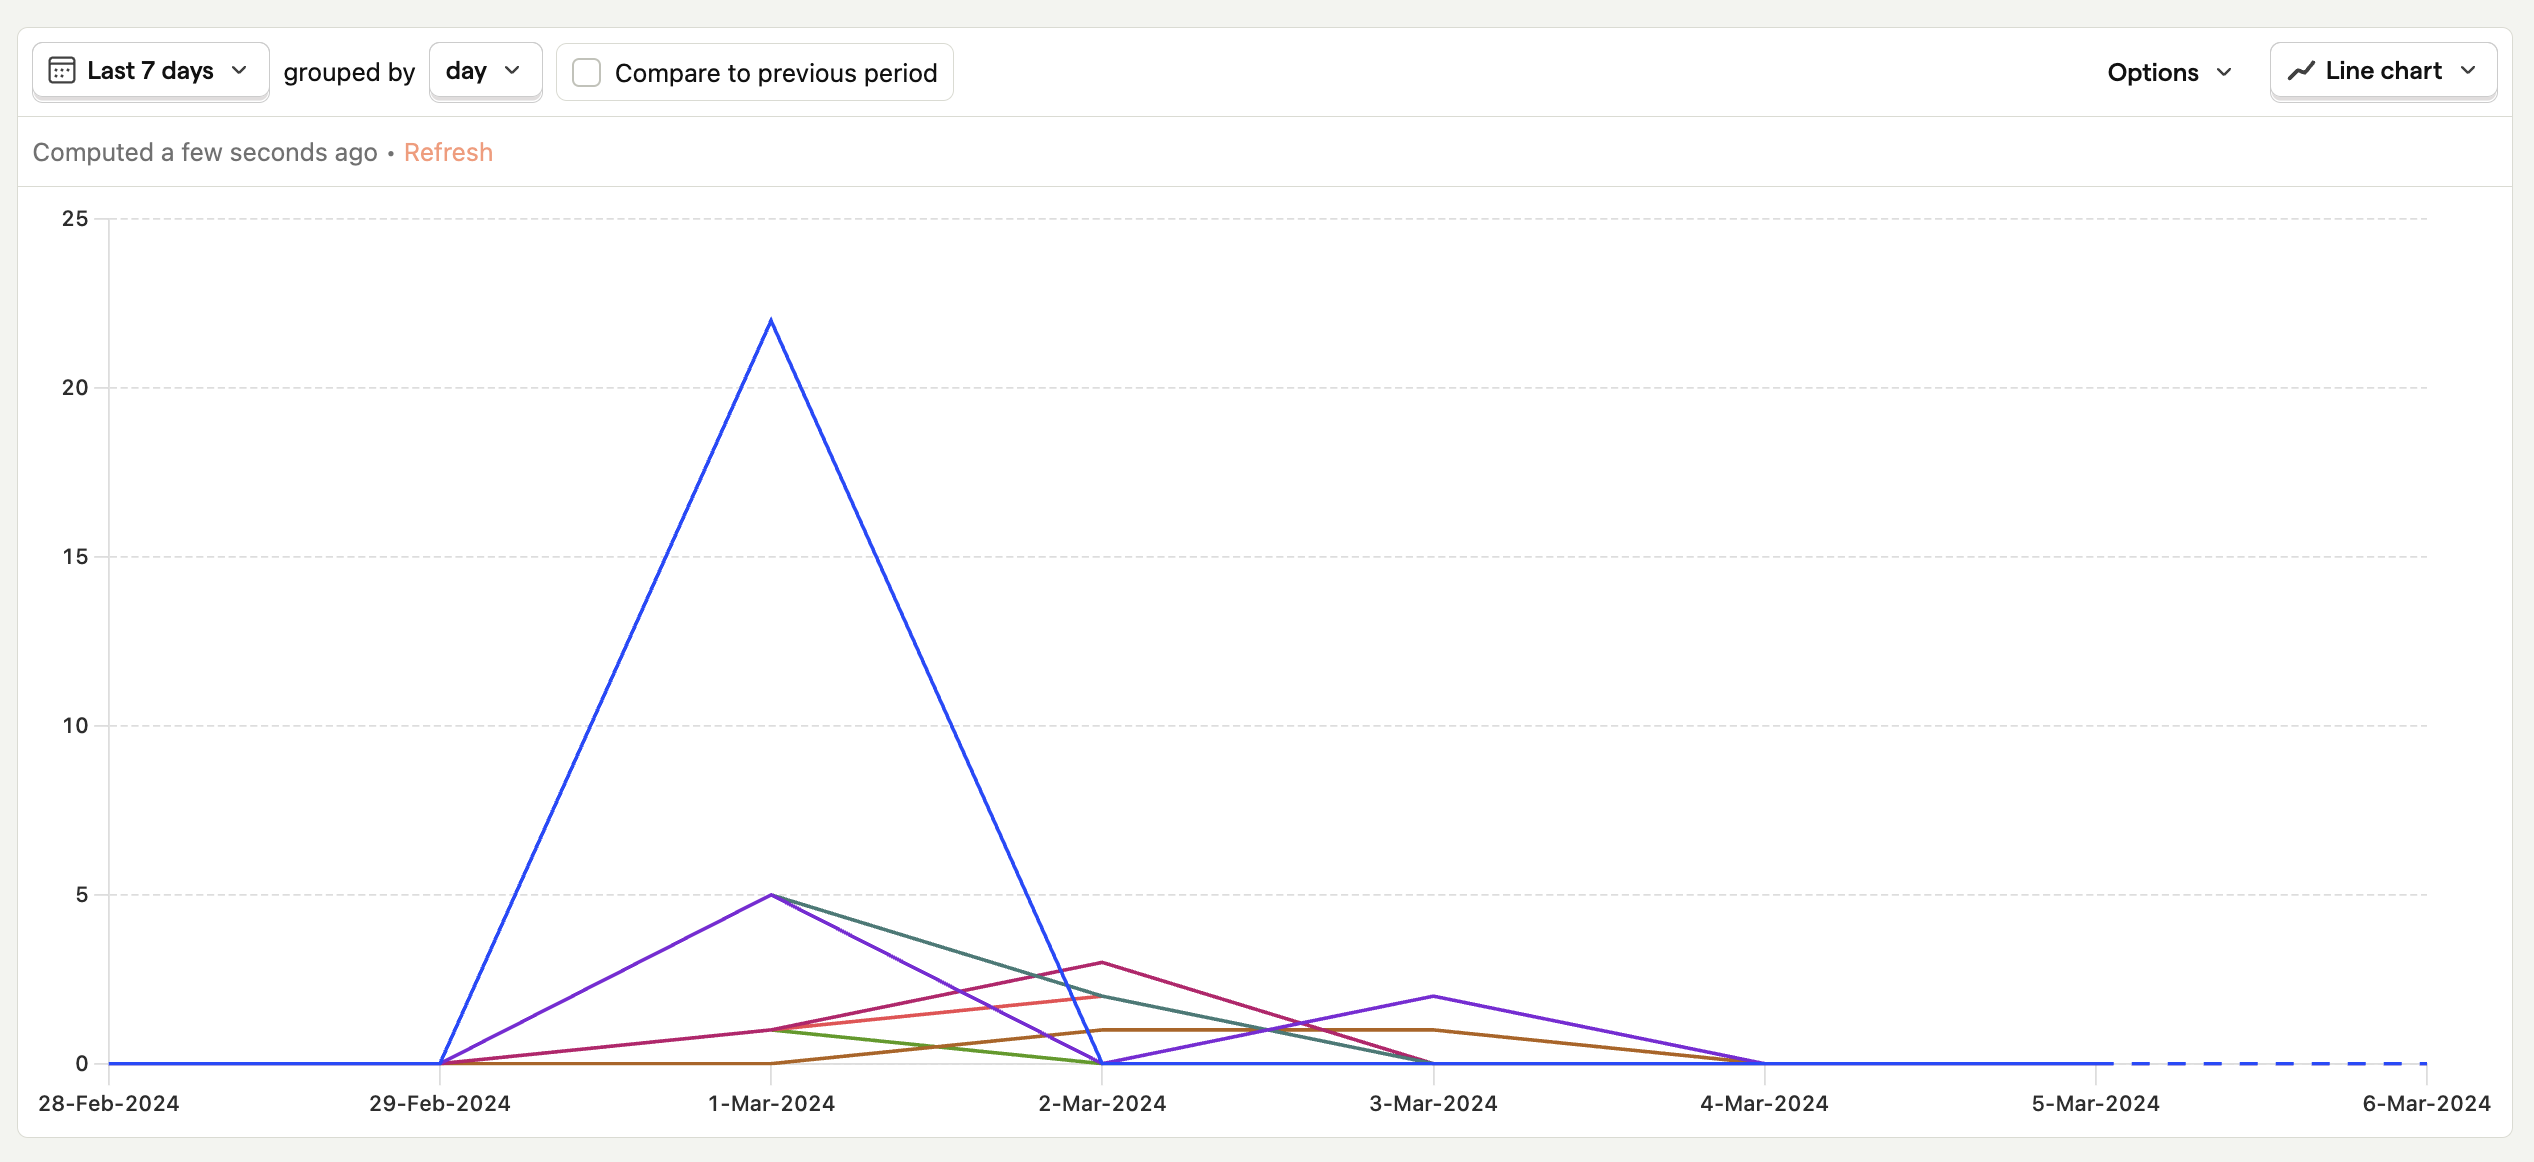
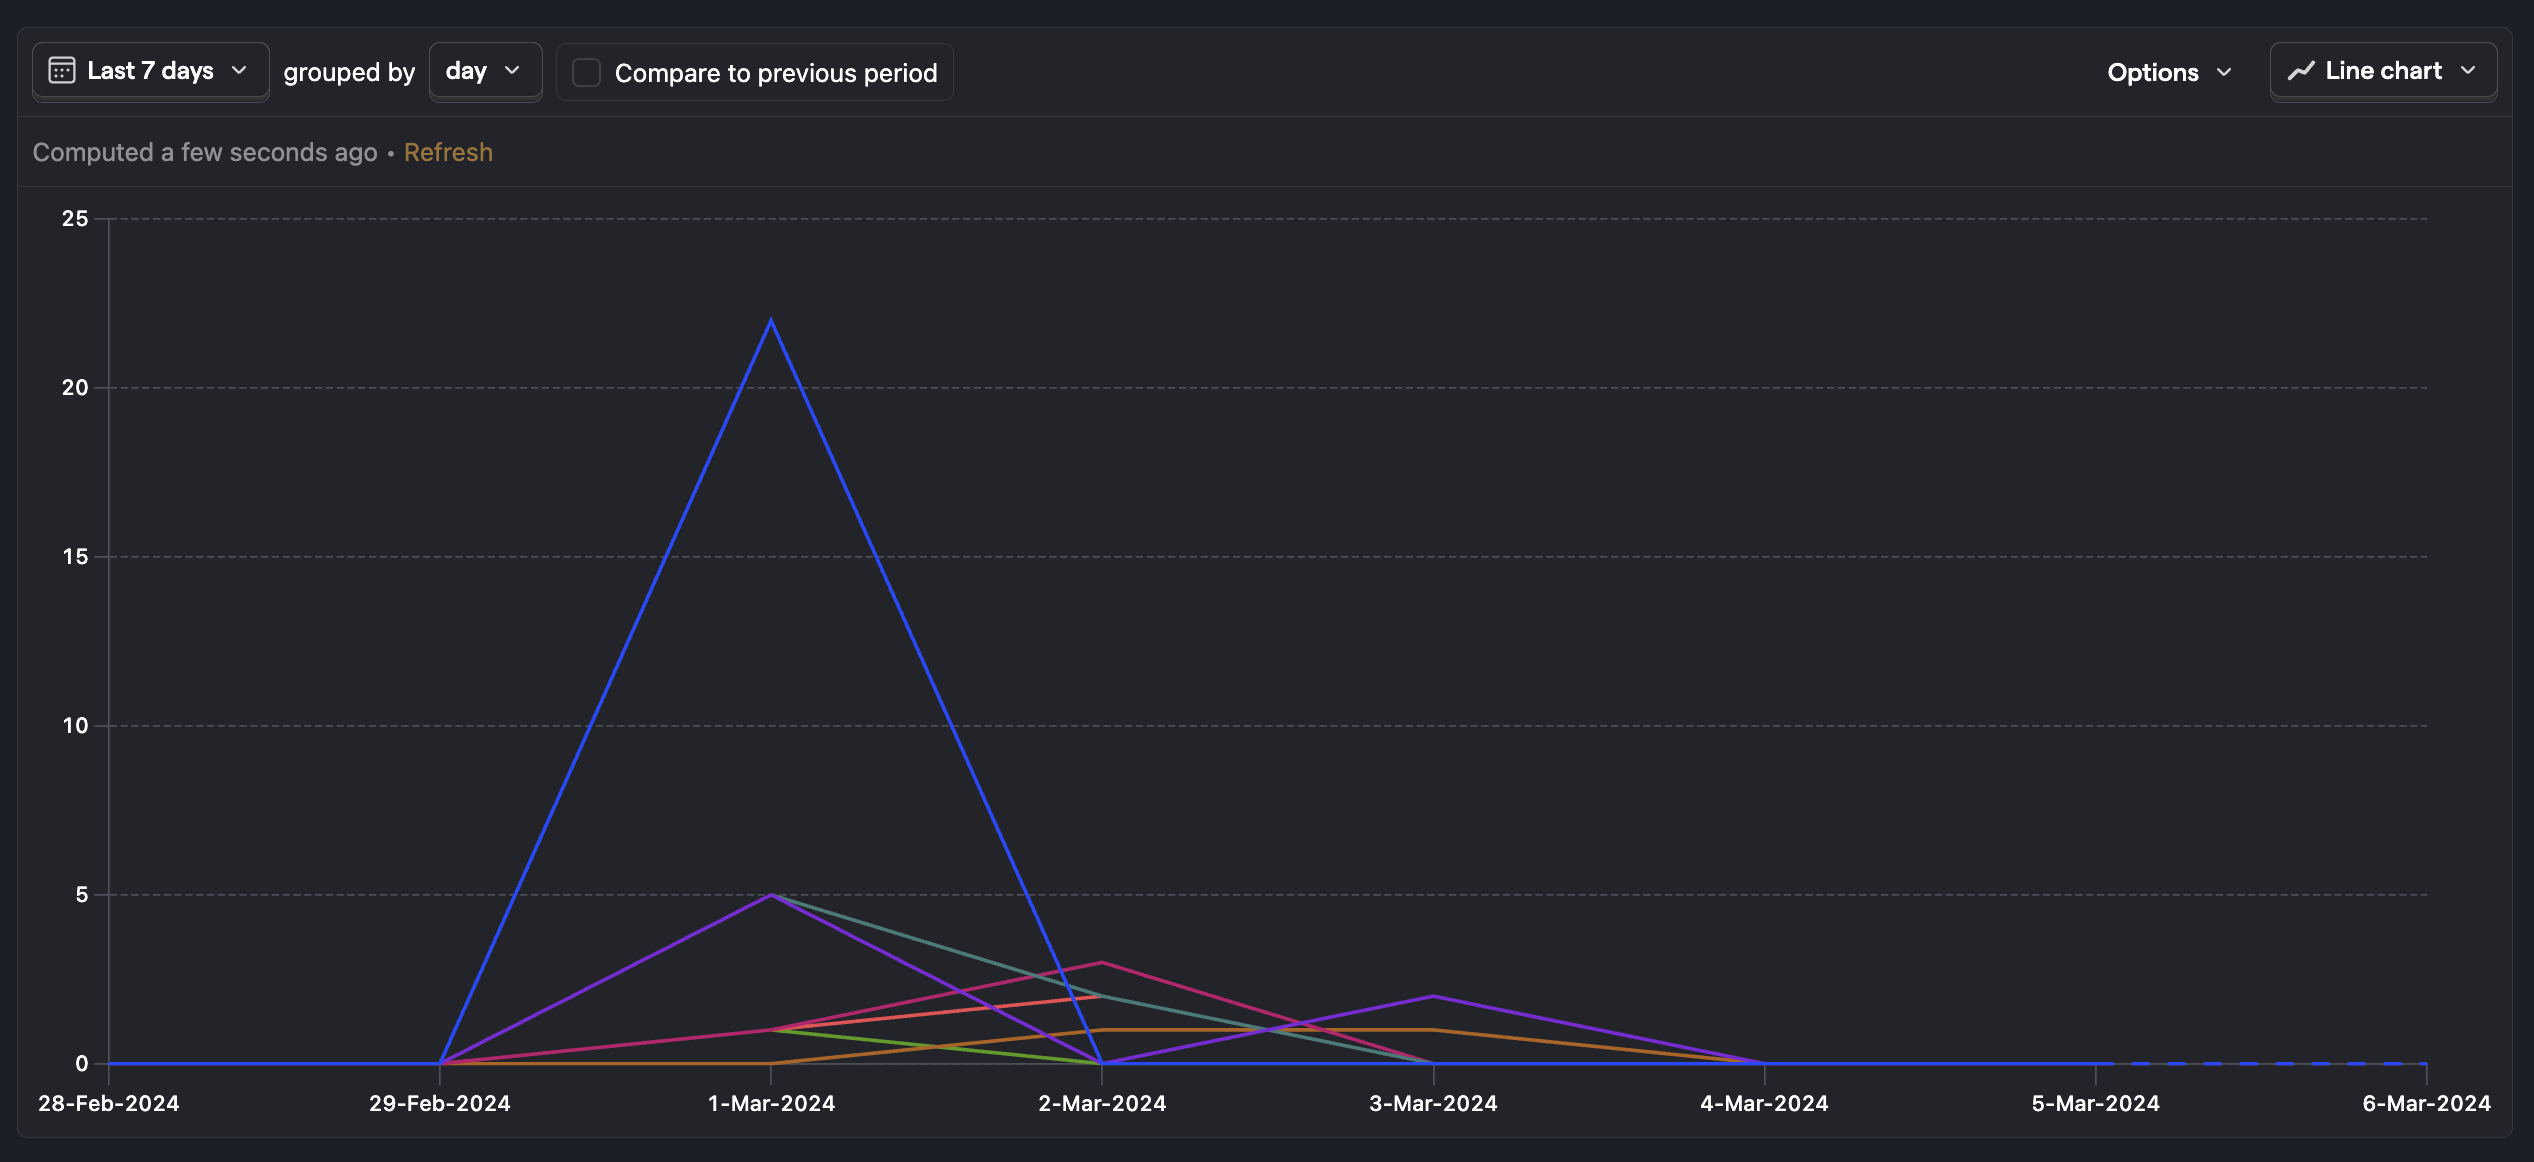
Once you've selected a property, you should see your graph split into multiple series, each one corresponding to a distinct value of that property.
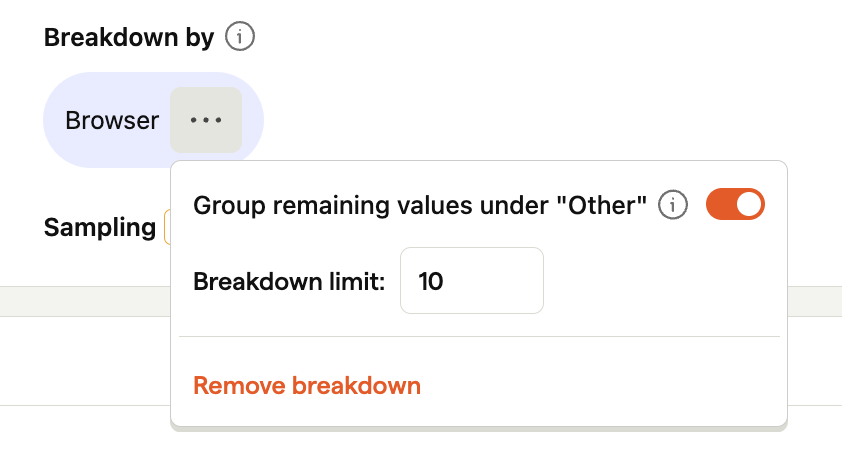
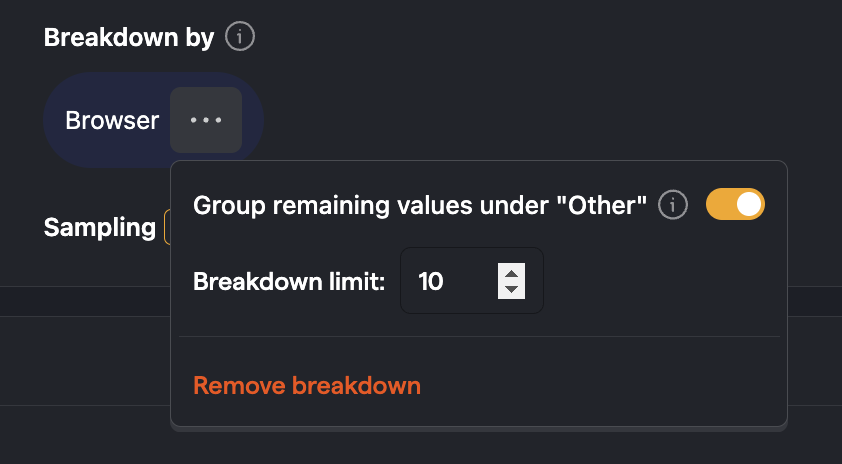
For readability, PostHog only loads the first 25 values of a breakdown when you first load an insight. You can manually load more values by clicking the 'Load more breakdown values' button.
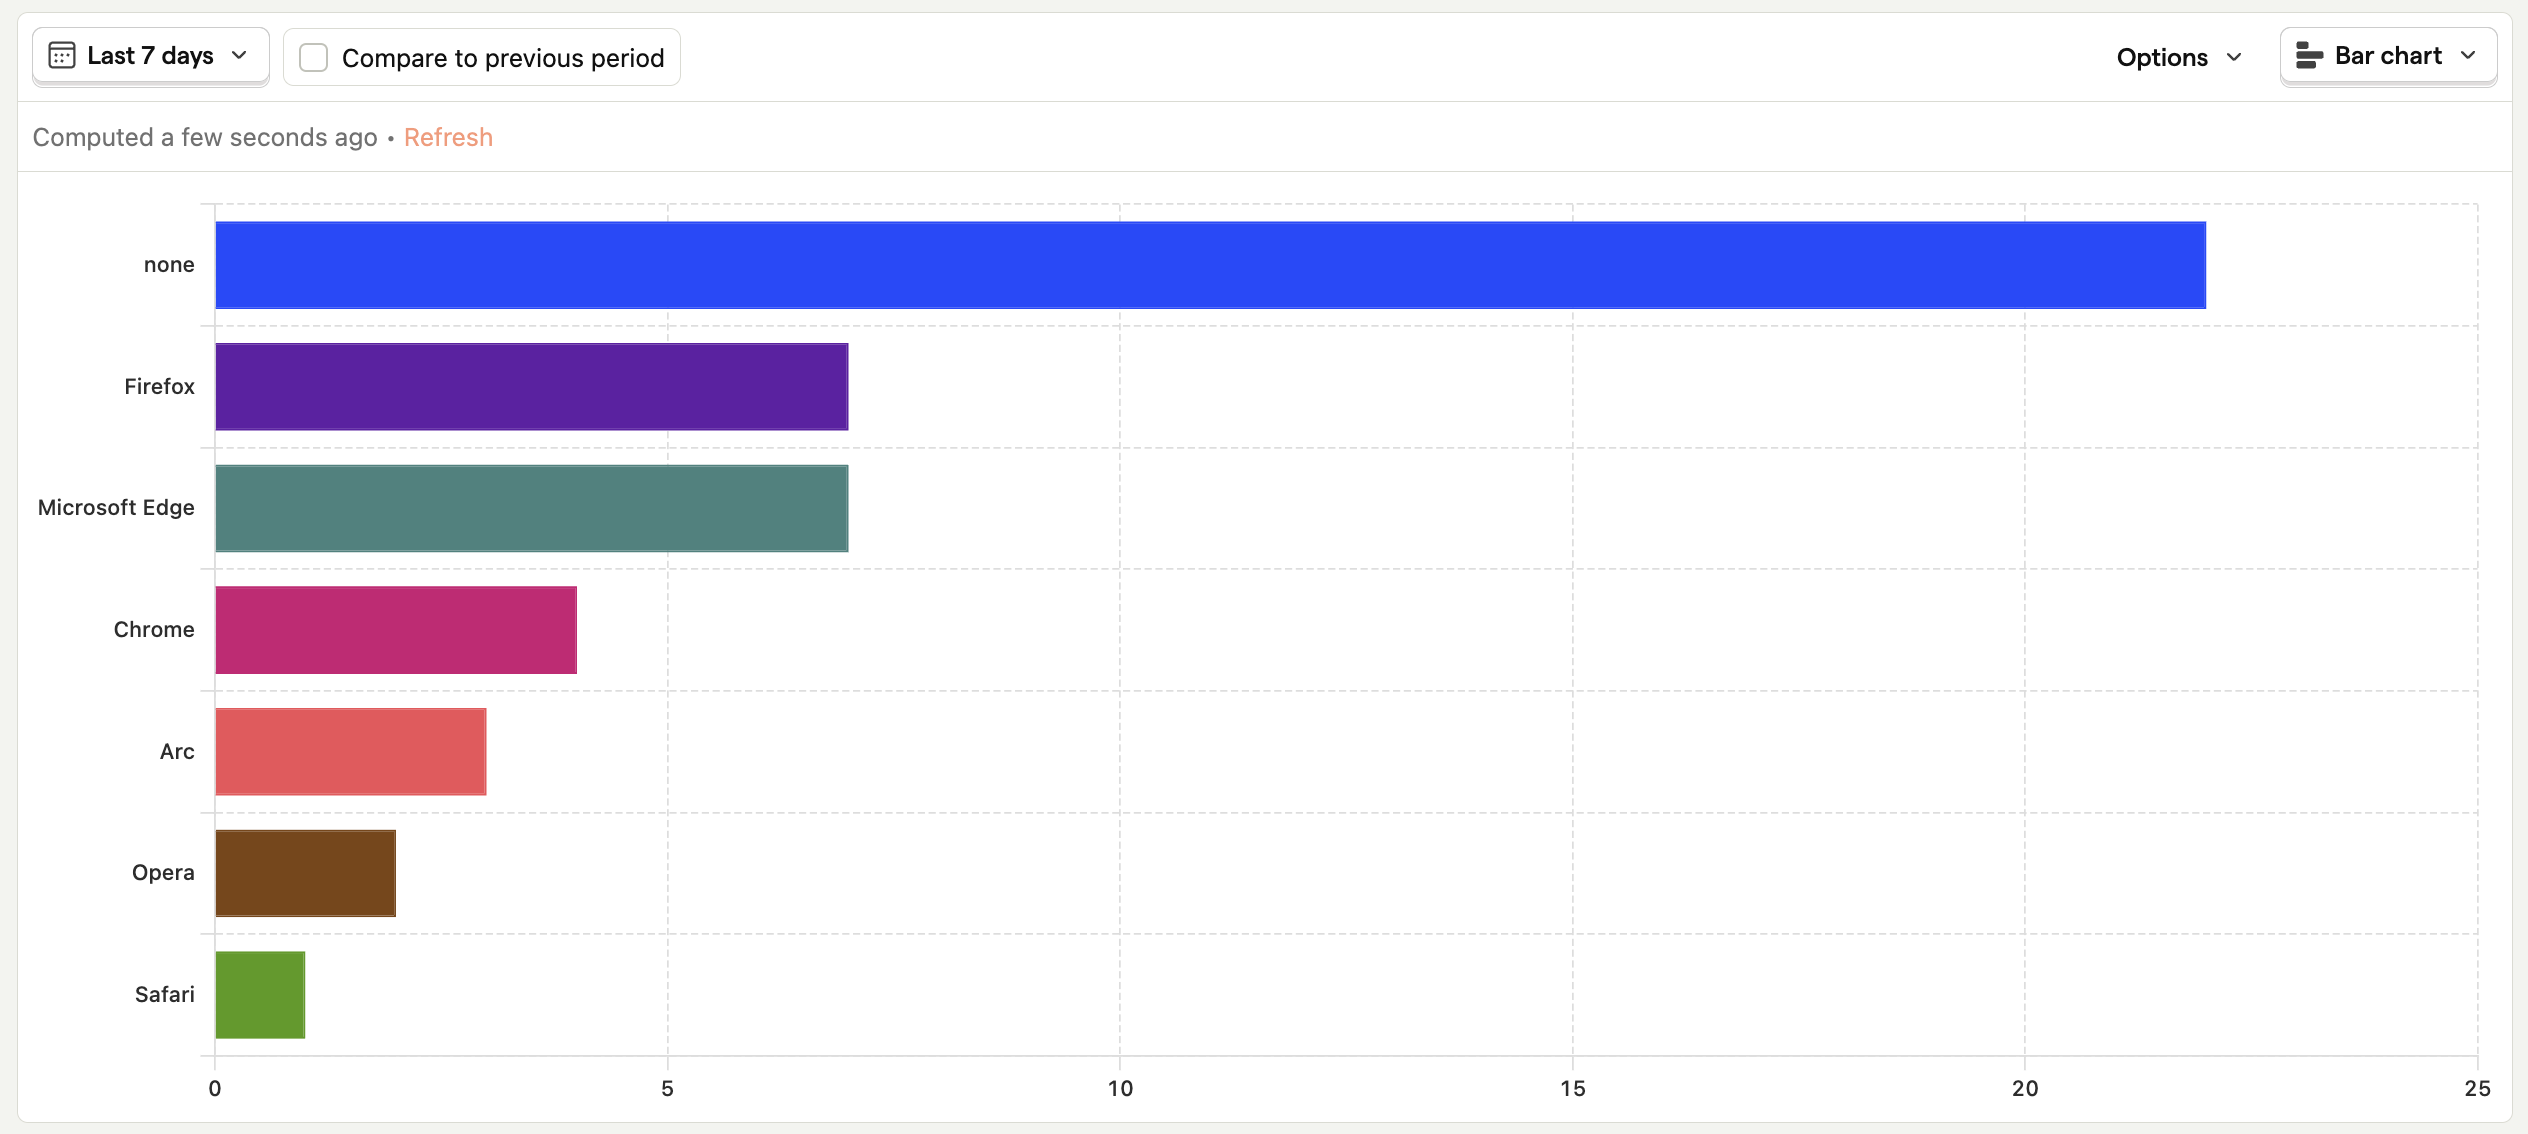
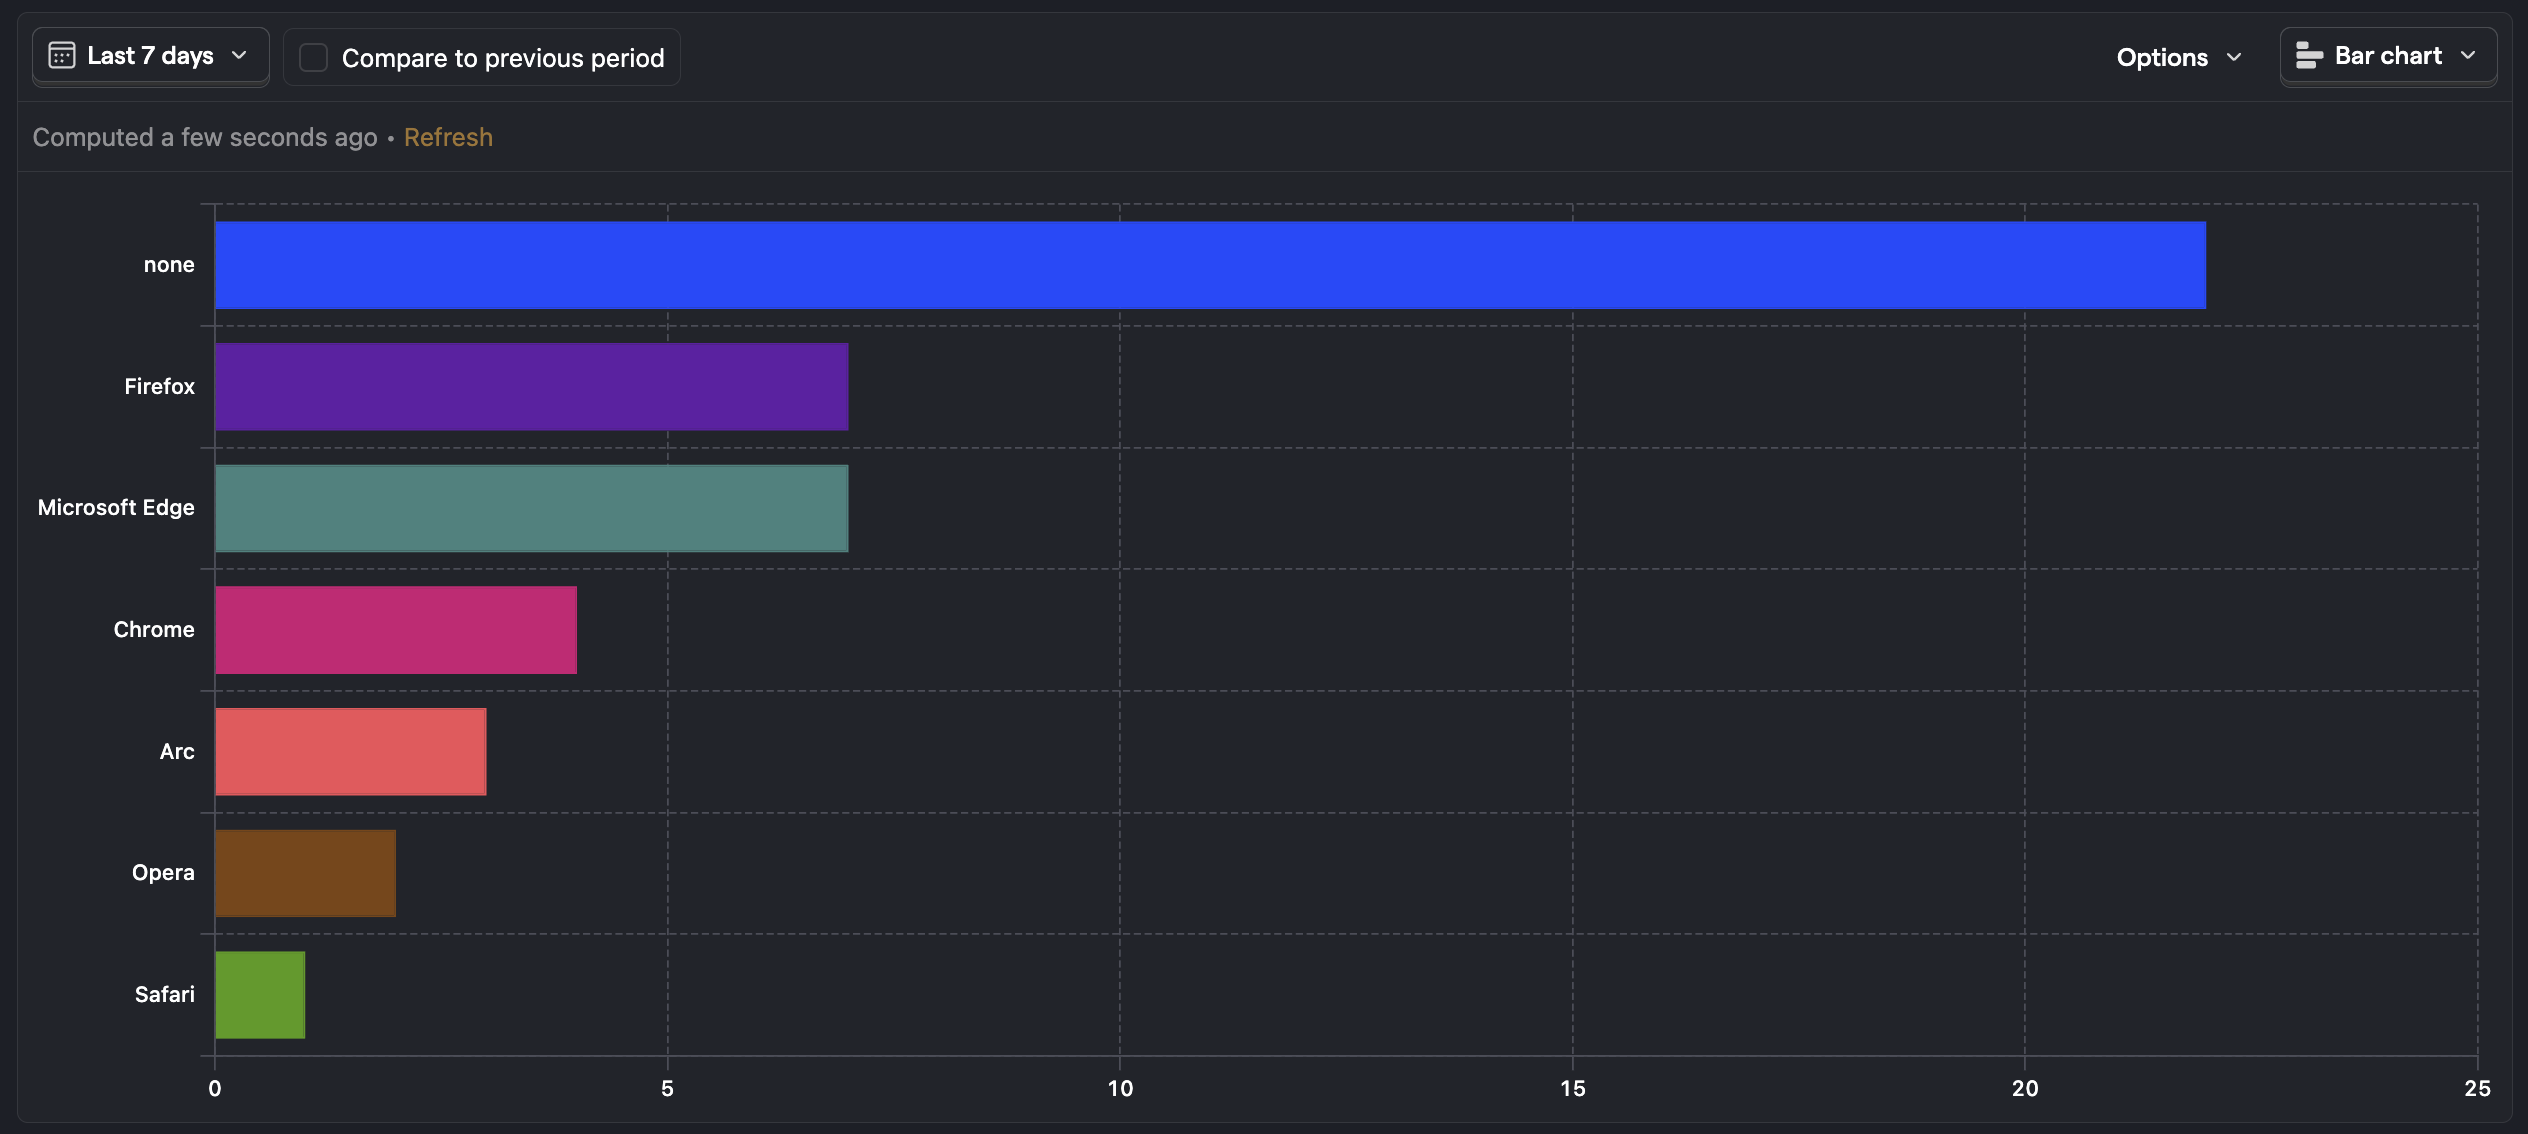
To just see the total count, switch to a total value bar chart or table like the one below.
Breakdowns only support a single property at a time, unless you use HogQL. To breakdown by the combination of browser and operating system, for example, you can use the following expression:
See our HogQL expression docs for more information.
Cohorts and breakdowns
You can also break down trends insights by cohorts – a specific list of users you've created that is either static, or updated automatically based on pre-defined properties.
Unlike properties, you can break down insights by multiple cohorts at a time. This is useful if you want to compare how often different groups of users trigger a specific event, or complete an action.
When you create a breakdown using a cohort, an 'Add cohort' button will appear where you can add more cohorts to your breakdown.
Breaking down numerical values into bins
When breaking down based on a string value, your graph will be split up with separate series for every distinct value of that property. This works well for text values, but it's often too granular when trying to analyze numeric or time properties
To solve this, when breaking down a numeric property, you can select a number of 'Bins' to combine ranges of values into.
PostHog will then break up your events into the specified number of bins based on the distinct values of the property. For example, if your property can take the values 20, 21, 22, ..., 40 and you split it up into 10 bins, it will break your events up into ranges of 20 - 22, 22 - 24, etc. This aggregates all breakdown values, not just the top 25 ones, like it happens for non-numeric values.
To have more customization over bins or to bin any type of property, use HogQL.