There are numerous ways to aggregate events and properties in trends, so you can go beyond just tracking the total number of events.
Aggregations enable you to answer questions like:
- What is the average session duration of users on my site?
- How many unique users have used a feature within the last month?
- What is the 95th percentile in time spent loading?
- How often do users perform a specific event or action?
- How do power users and a non-power users behave?
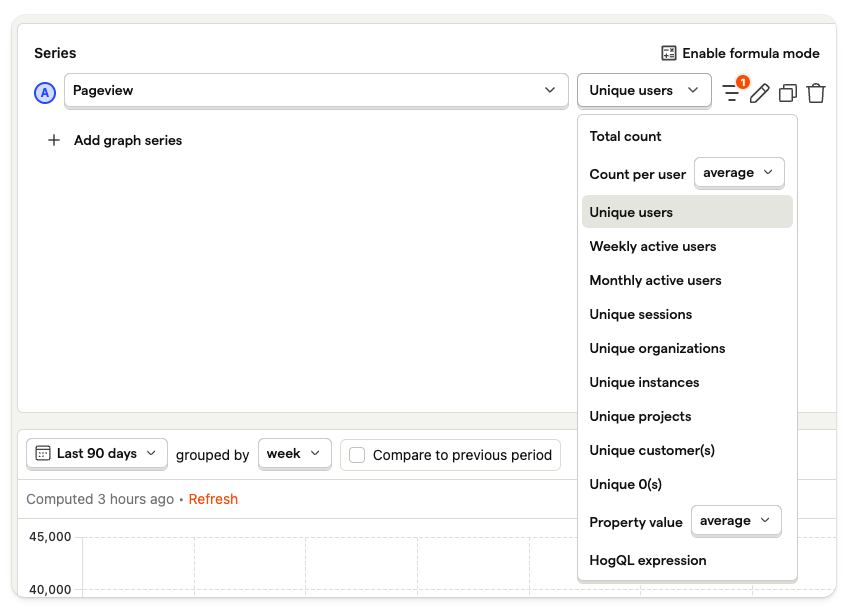
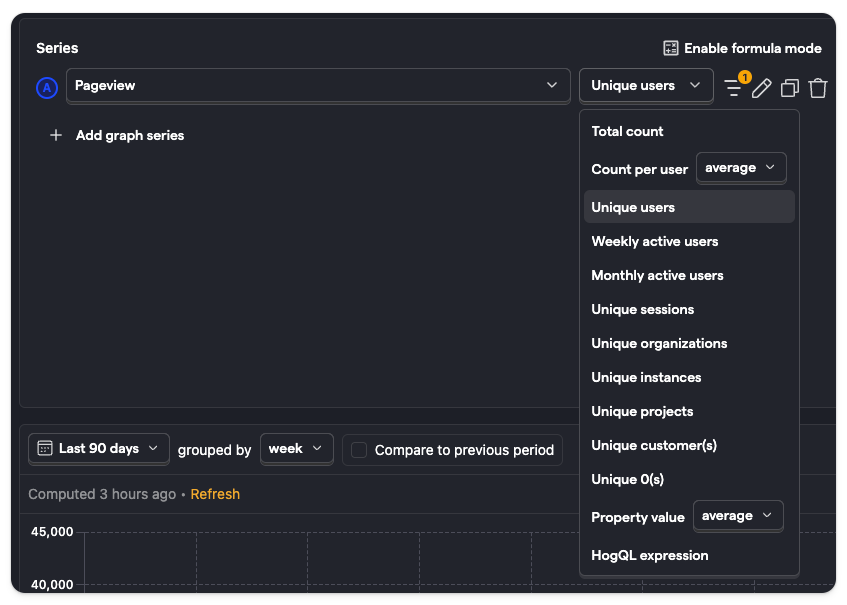
Event aggregation
Event aggregation determines how the number of events within a certain period are formatted and calculated. In this case, the aggregation is done based on how events are grouped, so if events are grouped by 'Day', then all events on a given day are aggregated based on the chosen method.
| Event aggregation | Description |
|---|---|
| Total count | The total number of times this event was performed in a given period. |
| Count per user | The total number of times a per users performs this event, broken down by Average, Minimum, Maximum, Median, or 90th/99th/99th percentile. |
| Unique users | The total number of unique users who have performed this event in a given period. Example: If the same user performs an event twice, this will only count it as 1. |
| Weekly active users (WAU) | The total number of unique users who have performed this event within the last 7 days. This is a rolling count for each period, counting the previous 7 days. |
| Monthly active users (MAU) | The total number of unique users who have performed this event within the last 30 days. This is a rolling count for each period, counting the previous 30 days. |
| Unique sessions | The total number of unique sessions within the given period where this event was performed. |
| Unique groups | The total number of unique groups that performed these events within a period. See our group analytics docs for more. |
Property value aggregation
Property aggregation enables you to combine and plot the values of a property. Property aggregation only works on properties with numerical values.
| Property aggregation | Description |
|---|---|
| Average | The average value of a property |
| Sum | The sum of values of a property |
| Minimum | The minimum value of a property |
| Maximum | The maximum value of a property |
| Median | The median of the distribution of property values |
| 90th percentile | The 90th percentile of the distribution of values (90% of events have a property value less than this) |
| 95th percentile | The 95th percentile of the distribution of values (95% of events have a property value less than this) |
| 99th percentile | The 99th percentile of the distribution of values (99% of events have a property value less than this) |
HogQL expressions
You can also create your own aggregation using HogQL. This enables you to use SQL operators and functions to customize how data is formatted and calculated. For an example, see our tutorial on the power of HogQL’s sum() aggregation.