A session is a set of events that try to capture a single use of your product or visit to your website. They are used in multiple areas of PostHog:
- Session replays
- Web analytics
- Session aggregations
- Session properties
Sessions enable you to analyze how exactly users are using your product, their entry and exit points, how long they spend on your site, how active they are, bounce rate, and more.
How does PostHog define a session?
Our JavaScript Web library and mobile SDKs (Android, iOS, React Native, and Flutter) add a $session_id property to each event. Events captured from the same user, browser, and device get the same $session_id until there's no activity for more than 30 minutes (up to a maximum of 24 hours). Subsequent events are grouped into a new session and a new session triggers a new session replay.
A session can span multiple tabs and windows, but only on the same browser and device. For example, if a user goes from one Chrome tab to another, it counts as a single session. If they go from Chrome to Firefox, a new session is created. You can also create a new session by calling posthog.reset() (which also starts a new session replay).
Activity is defined as any event sent from the client including autocapture events and replay activity like mouse movement. The inactivity period can be configured using the session_idle_timeout_seconds configuration option.
Note: If you are migrating data or using a CDP, you may need to manually set the
$session_idproperty if you want to query sessions or connect them to session replays. If you are using the JavaScript Web SDK alongside your CDP, you can get this value by callingposthog.get_session_id().
Session properties
Session properties are data about the session that is autocaptured by PostHog and separate from event or person data. They can be queried and used like other properties in aggregations, filters, breakdowns, and more. Session properties include:
| Session property | Description |
|---|---|
$session_id | Unique identifier for a session, persists across events in the same session |
$start_timestamp | Timestamp when the session started |
$end_timestamp | Timestamp when the session ended |
$entry_current_url | URL of the page where the session started |
$entry_pathname | Pathname of the page where the session started |
$exit_current_url | URL of the page where the session ended |
$exit_pathname | Pathname of the page where the session ended |
$entry_utm_source | UTM source of the session start page |
$entry_utm_campaign | UTM campaign of the session start page |
$entry_utm_medium | UTM medium of the session start page |
$entry_utm_term | UTM term of the session start page |
$entry_utm_content | UTM content of the session start page |
$entry_referring_domain | Referring domain of the session start page |
$entry_gclid | Google Click ID when the session started |
$entry_gad_source | Google Ads source when the session started |
$pageview_count | Total number of pageviews during the session |
$autocapture_count | Total number of autocapture events during the session |
$channel_type | Type of channel through which the session was initiated |
$session_duration | Total duration of the session |
$is_bounce | Indicates if the session was a bounce (single pageview session) |
You can query all of these from the sessions table using SQL insights.
Using session data
The easiest way to analyze a session is to view a session replay. This enables you to playback and watch exactly what happened in that session. This includes events, navigation, mouse movement, console logs, and more.
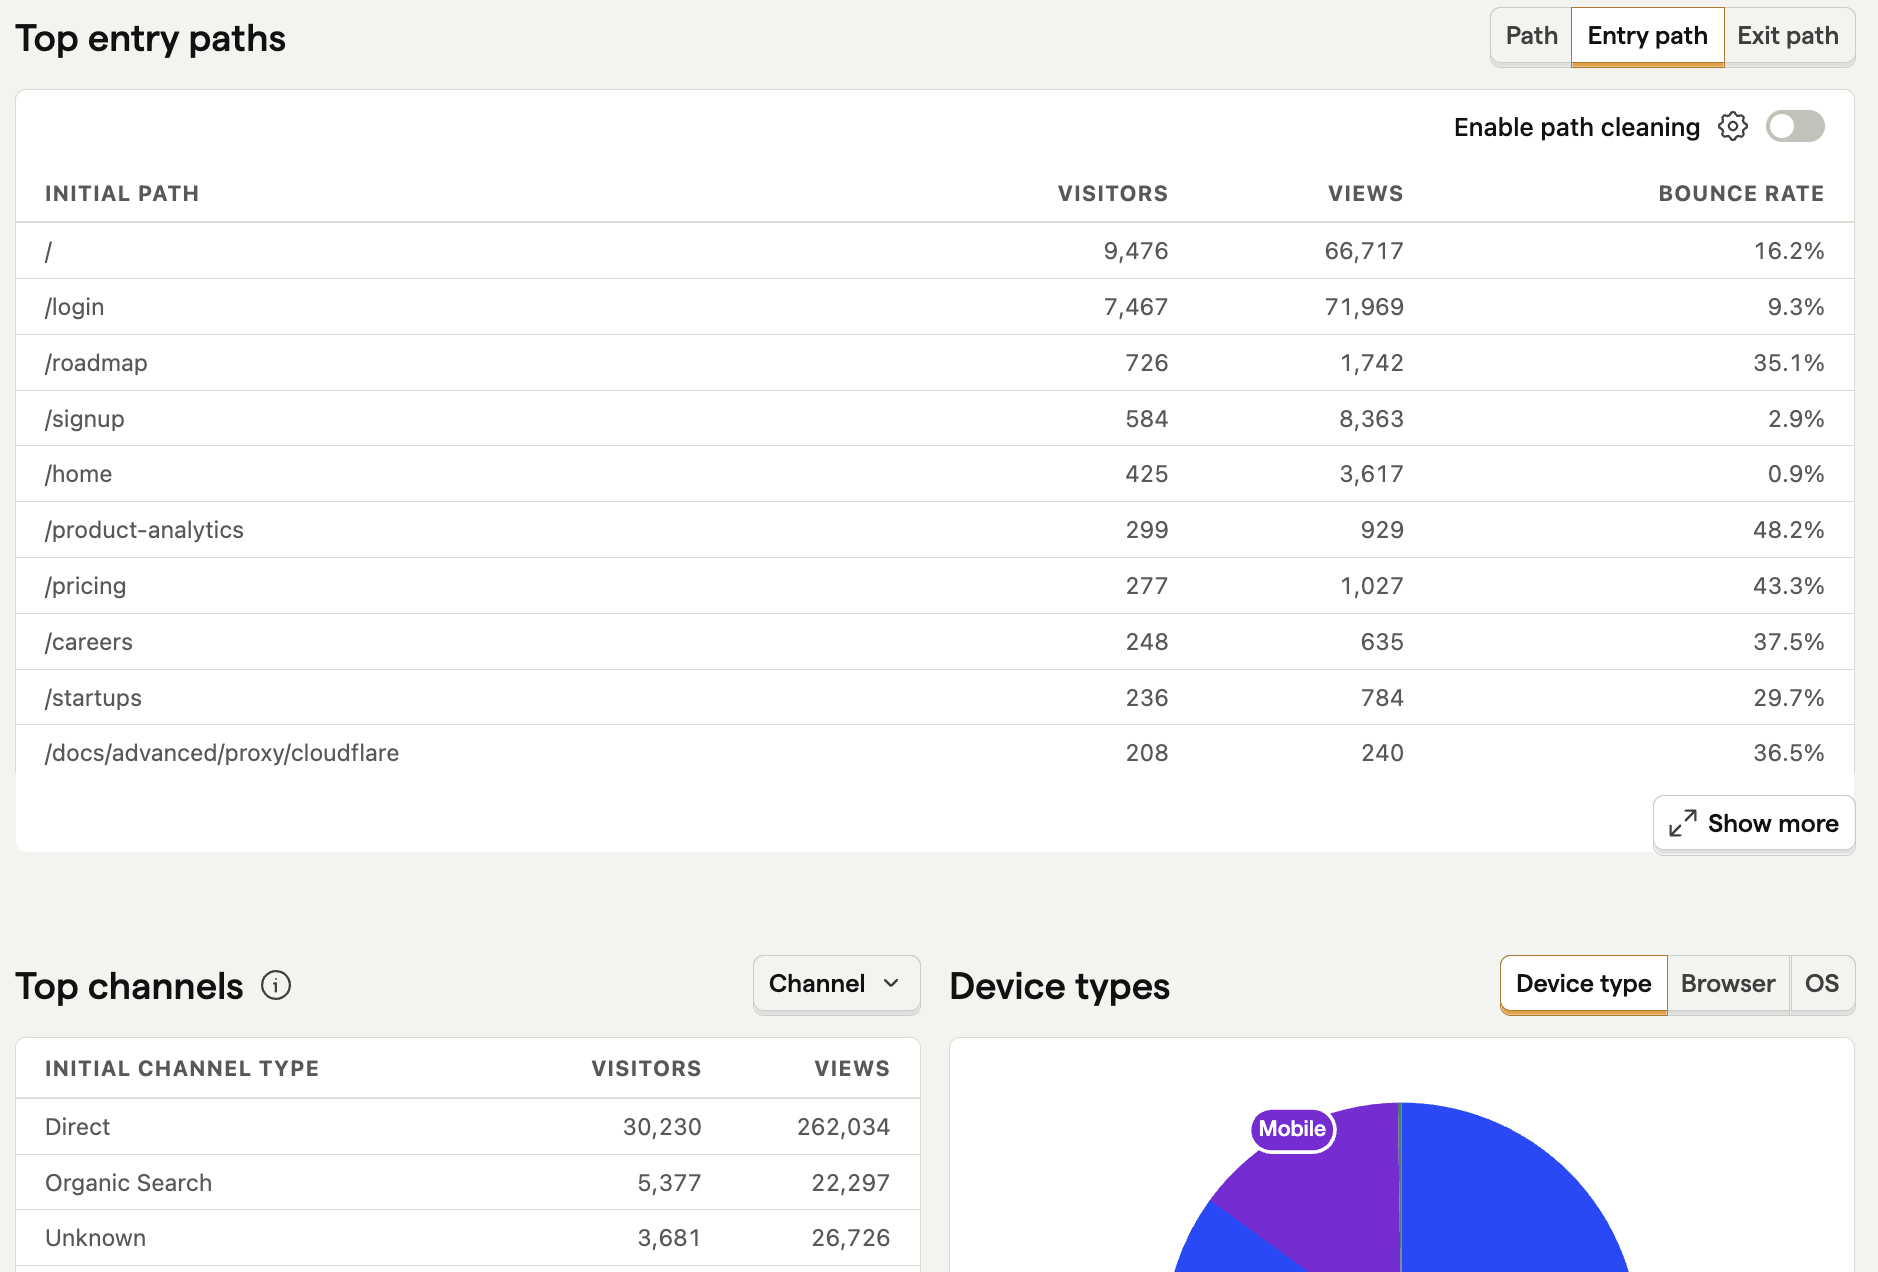
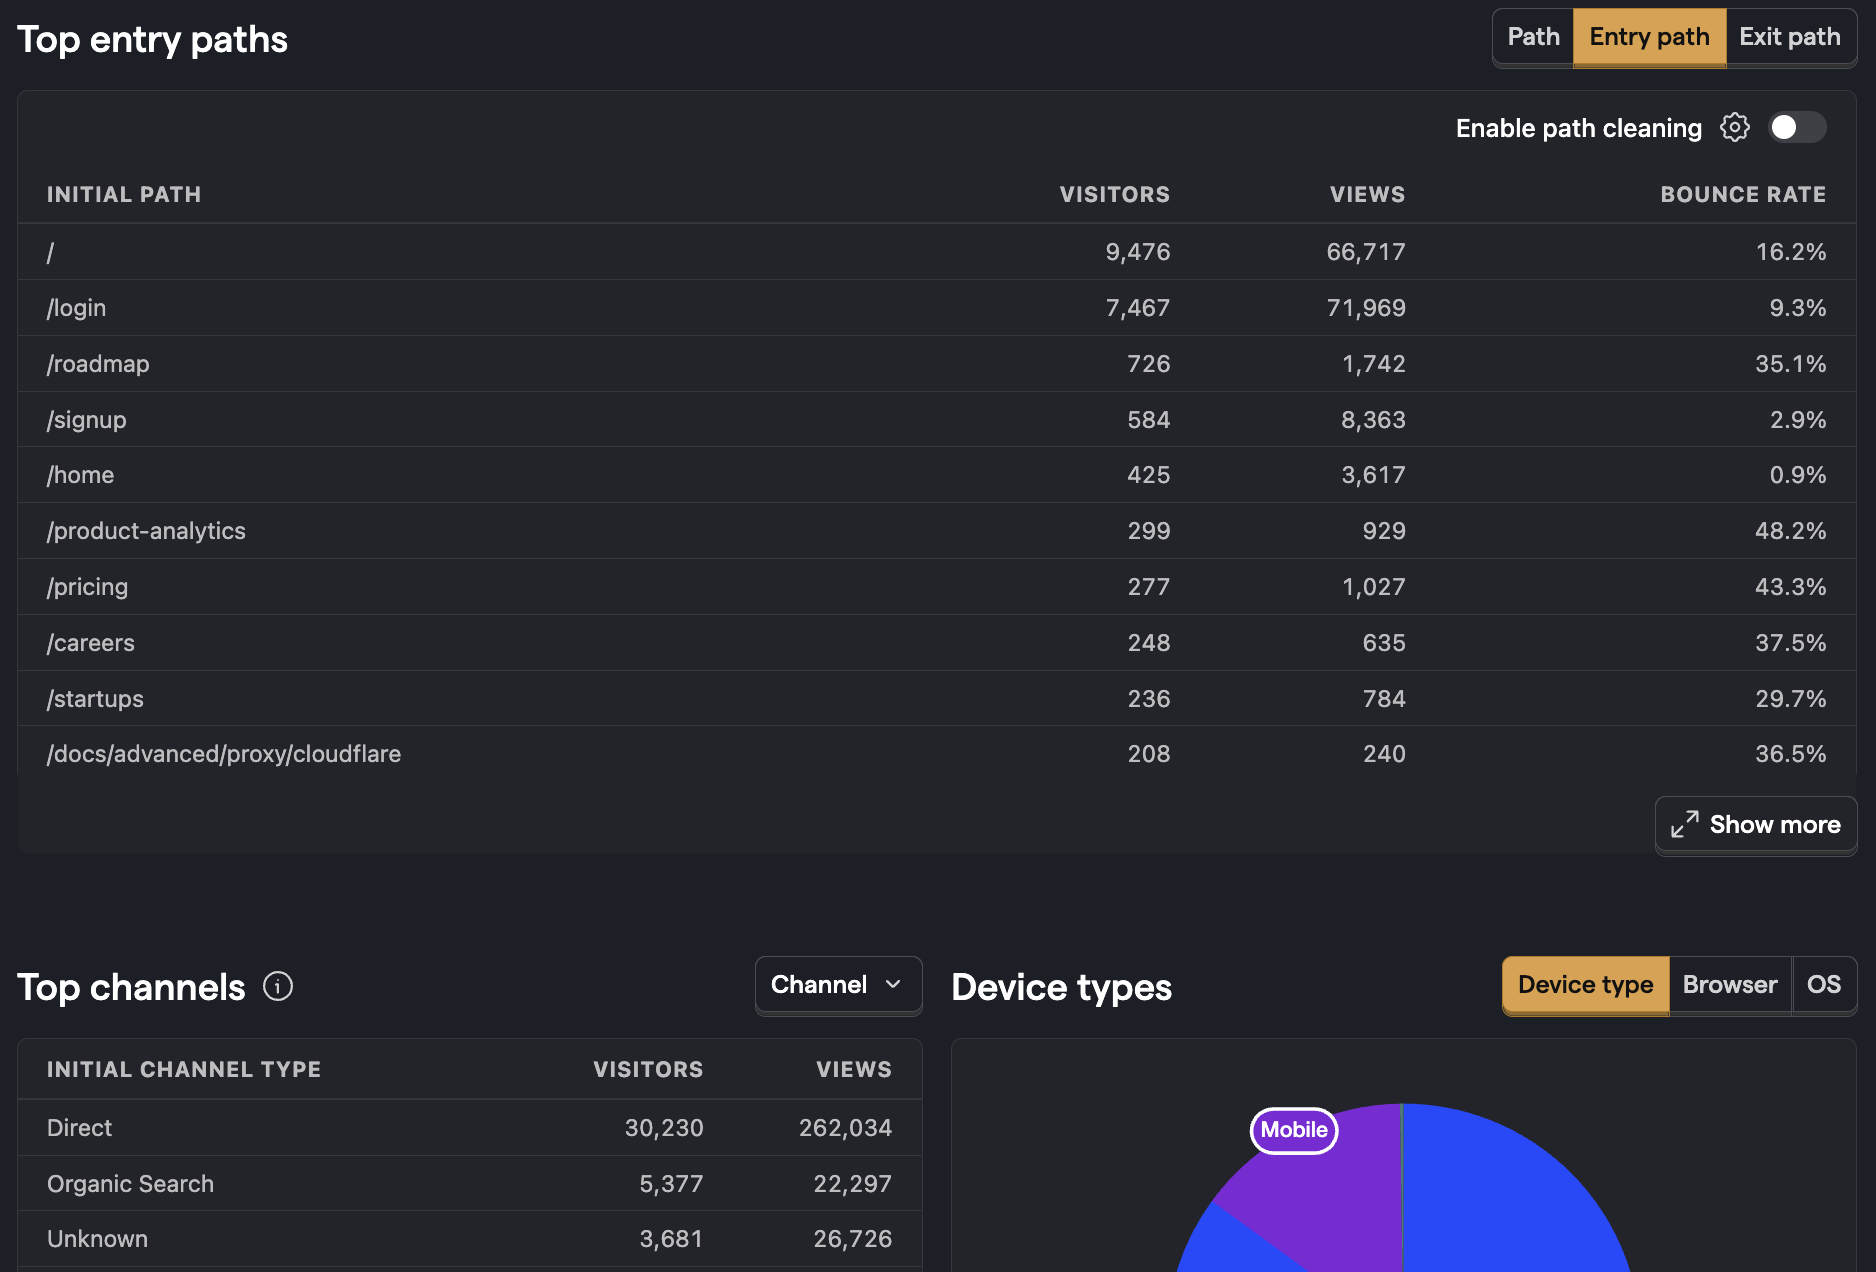
Web analytics also gives you an easily accessible overview. The top section contains sessions, session duration, and bounce rate, while further down provides more details on entry paths, exit paths, top channels, device types, and more.
For more detailed analysis, you can use insights to filter, break down, and aggregate session data.
Session aggregation
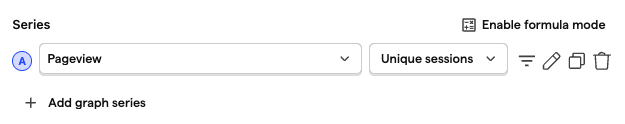
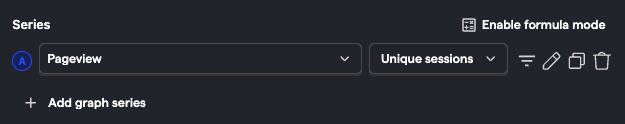
You can aggregate trends by Unique sessions just as would Unique users or Weekly active users.
This provides the count of unique sessions where the specified event occurred. This can be helpful to remove the noise if you have specific events that are sent a bunch of times within a single session.
To do this, select Unique sessions from the aggregation dropdown.
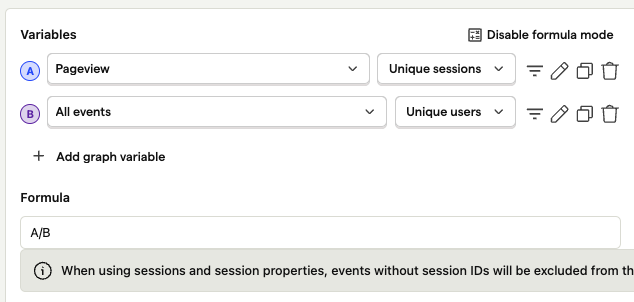
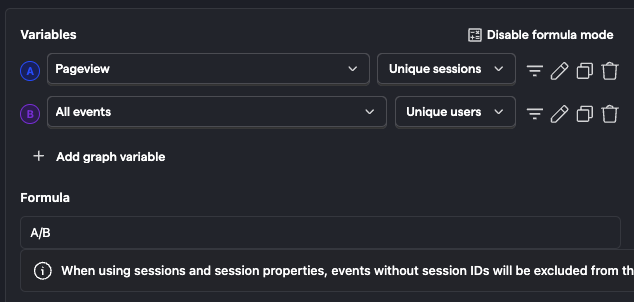
This can then be used in a formula to understand things like the average number of sessions per user or the average number of events per session.
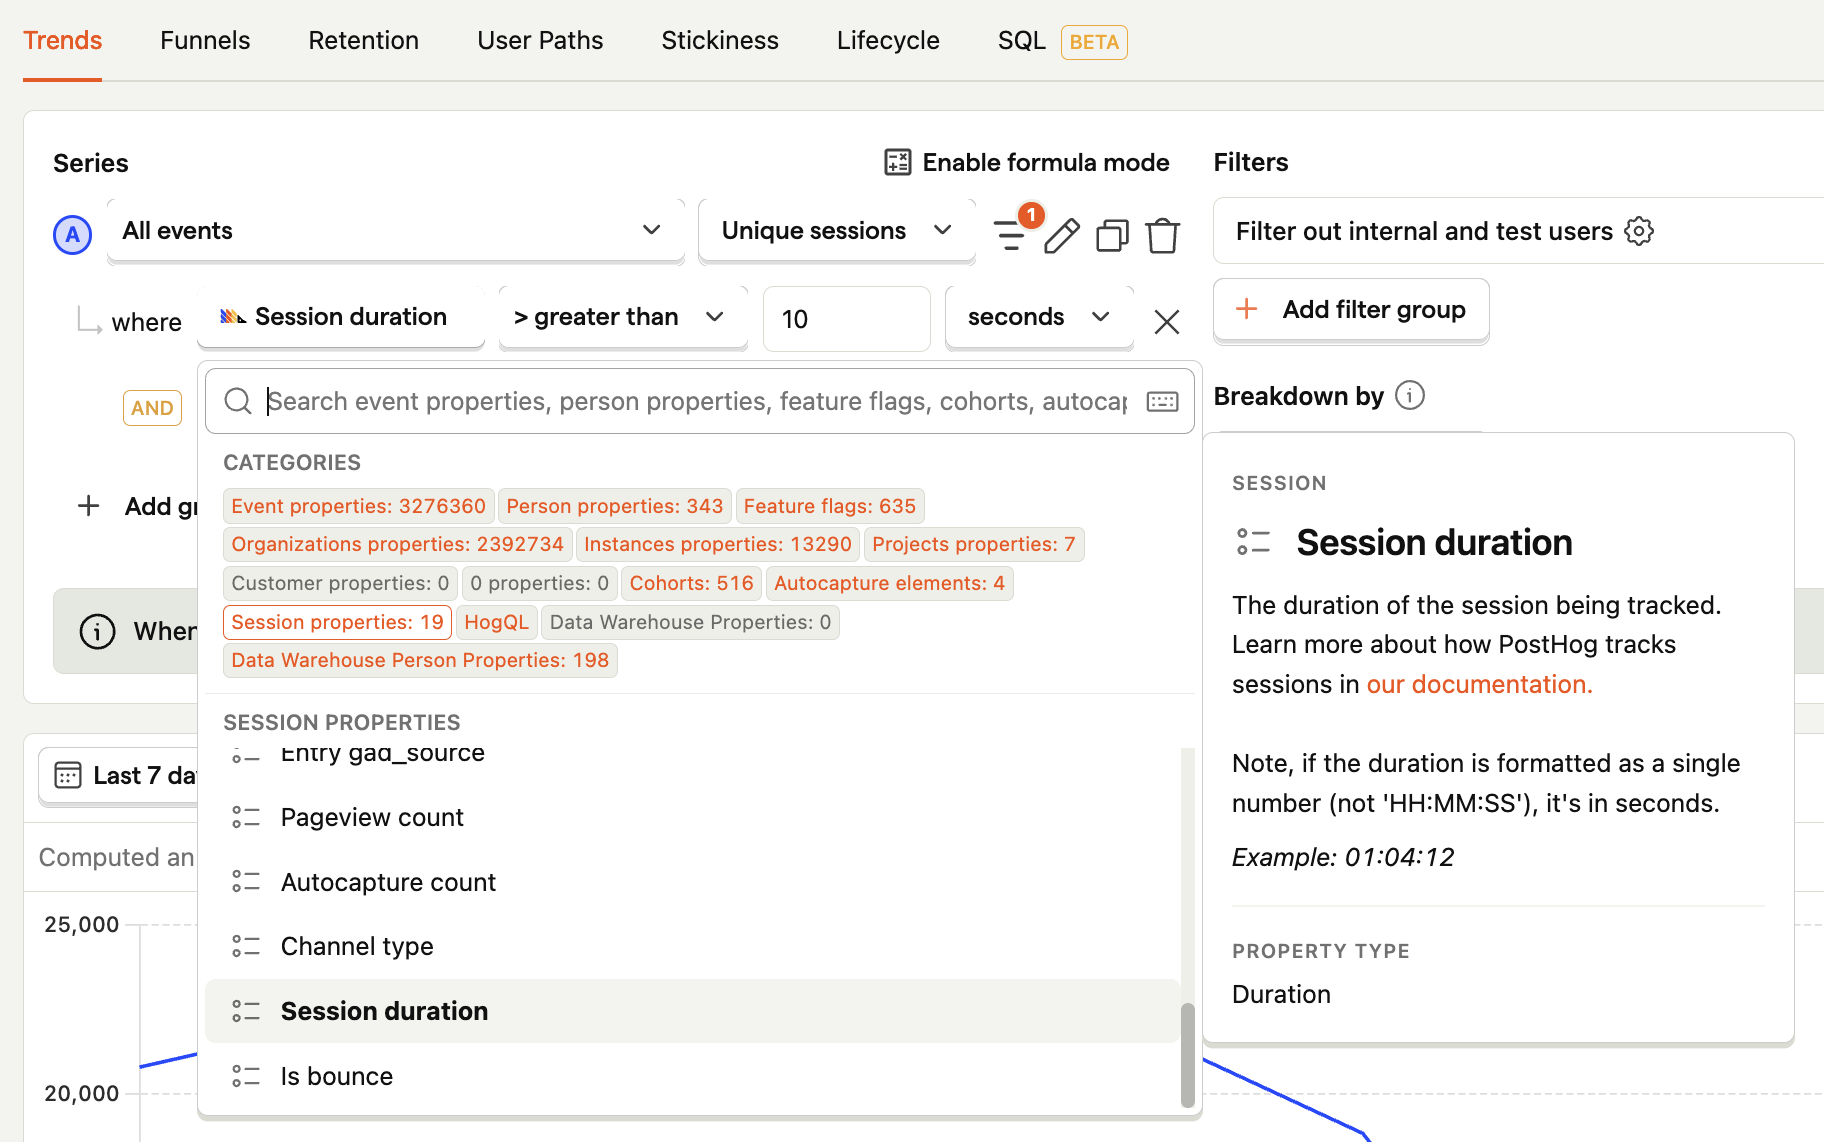
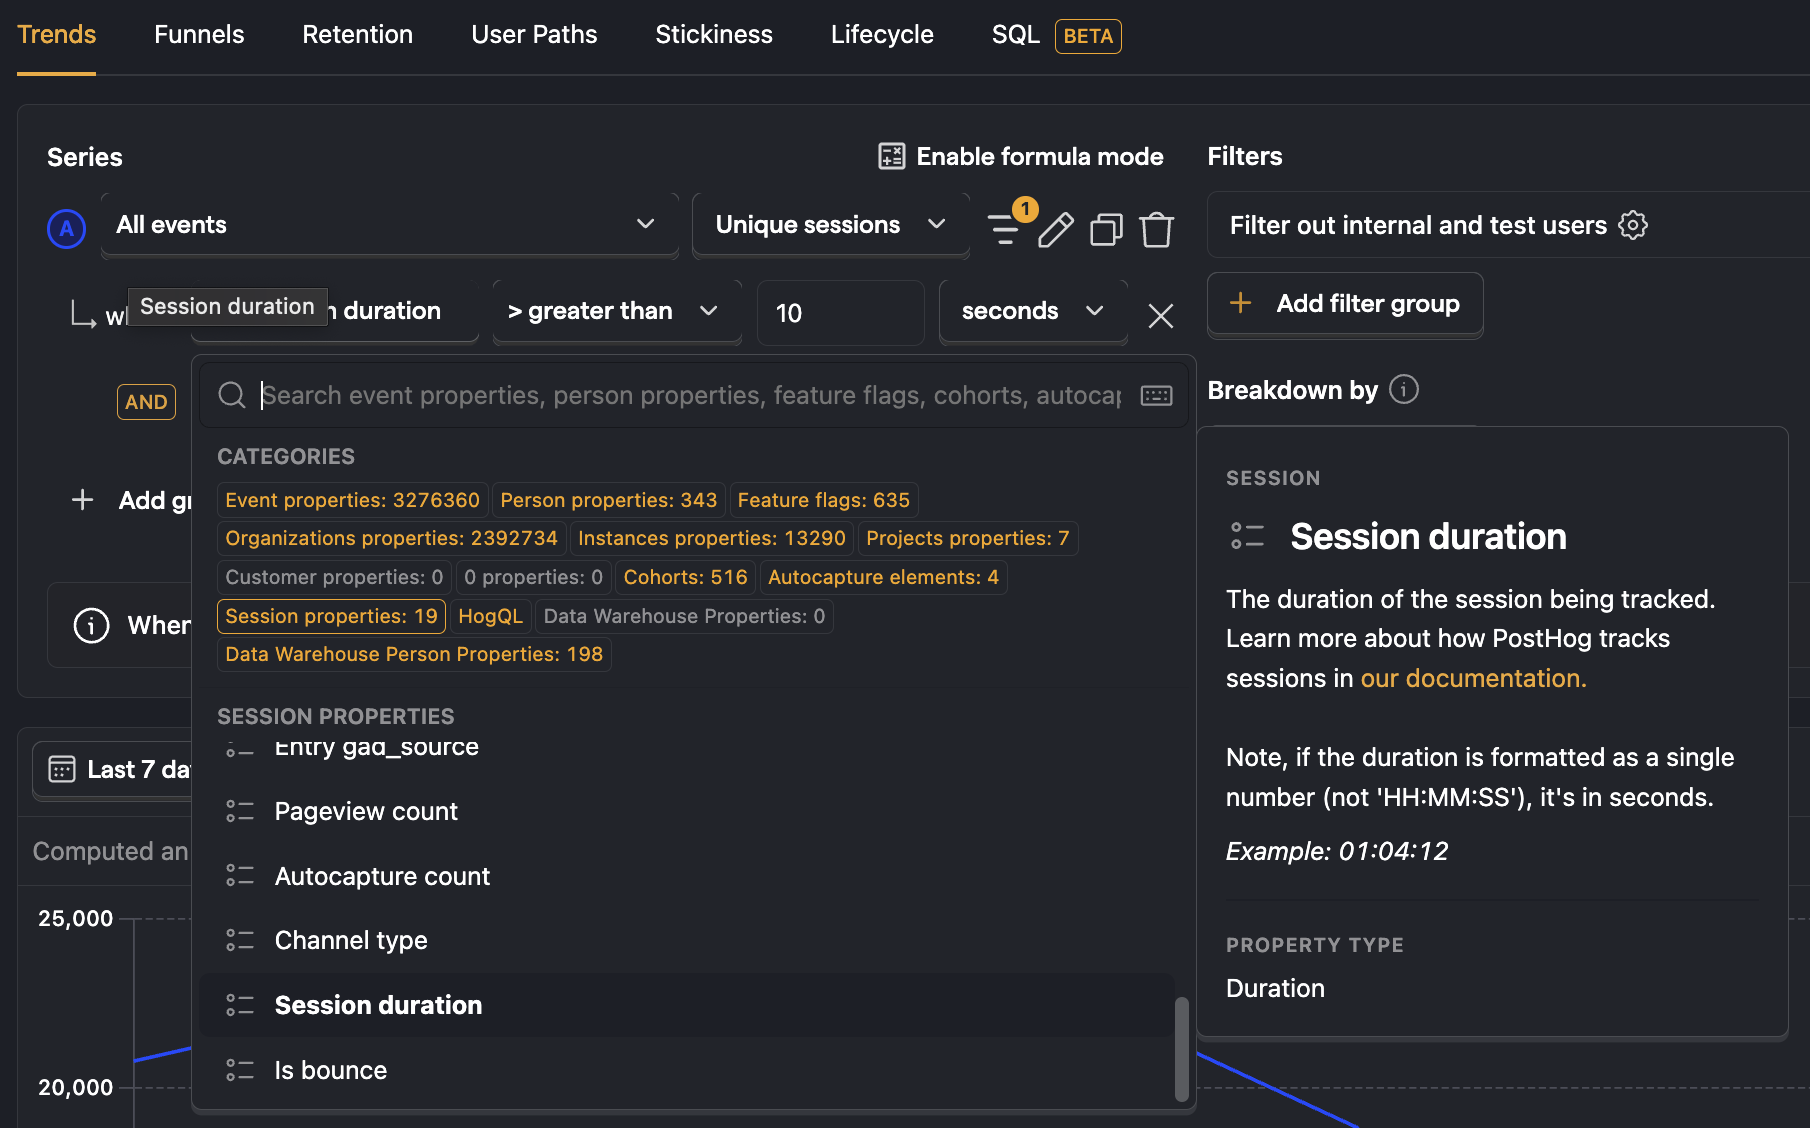
Filtering by session properties
You can use any of the session properties to filter your data. For example, to remove sessions that are shorter than 10 seconds, you can filter for sessions where duration is greater than 10 seconds.
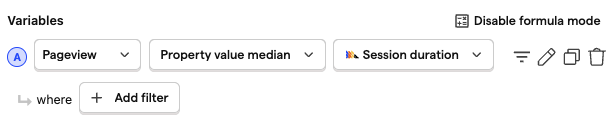
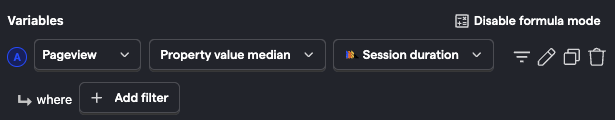
Plotting session properties
You can plot session properties over time like you would with an event count. To do this, select one of the property aggregators (e.g. median, 90th percentile, etc.) and then select the session property to plot. For example, to plot the median session duration, select Property value median and then select Session duration as the property.
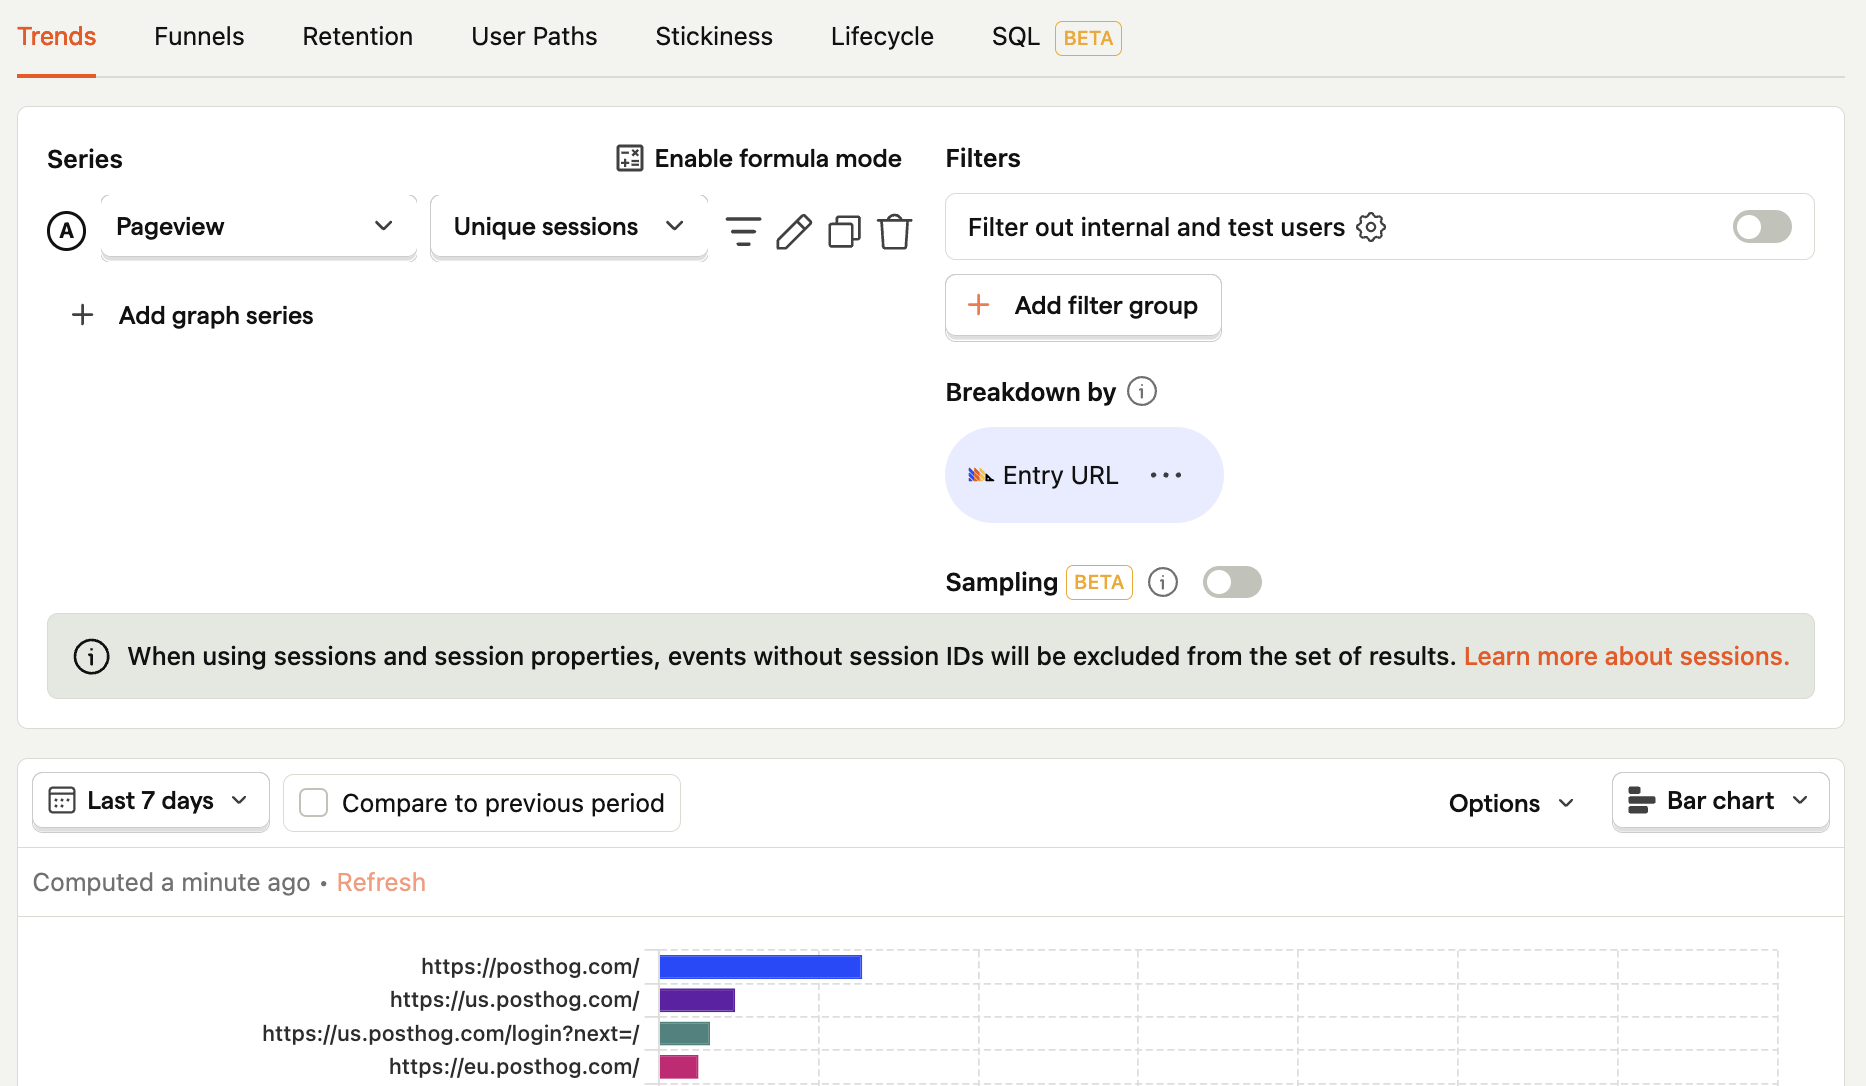
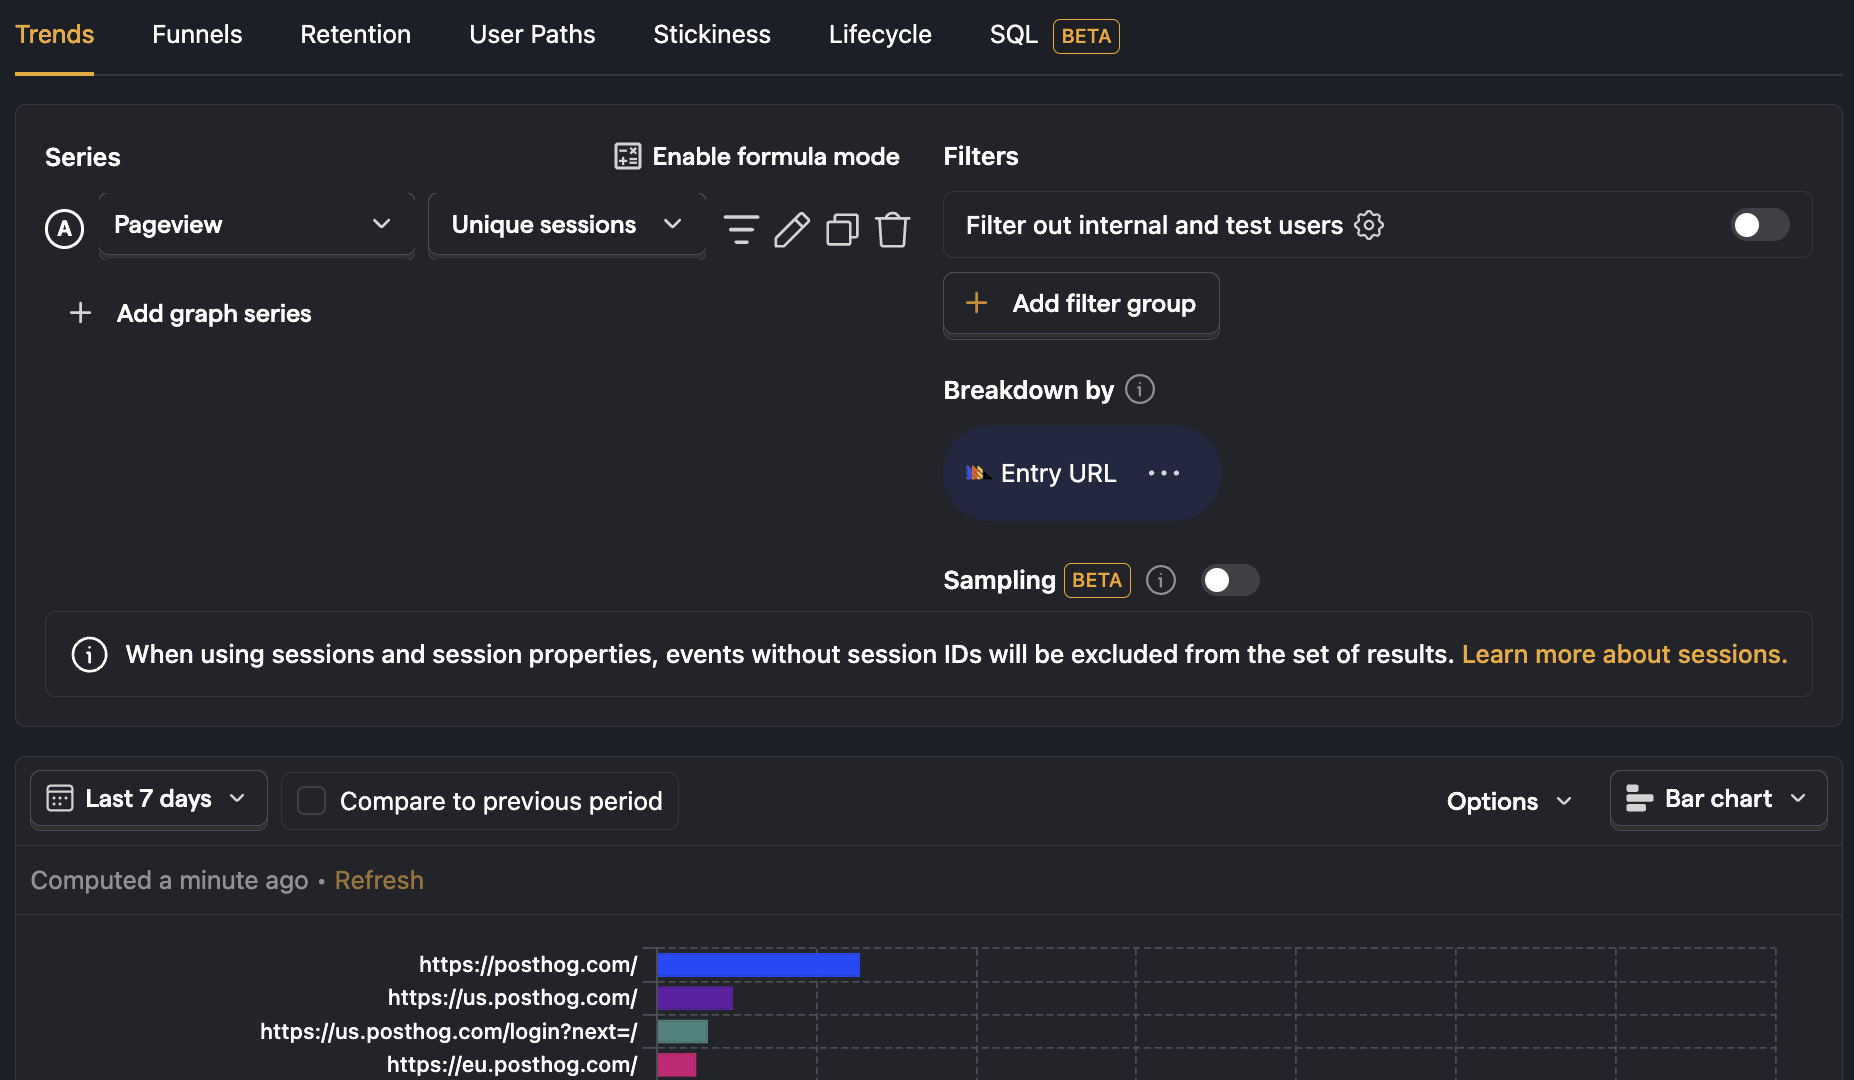
Breaking down by session properties
You can view the distribution of different session property values by breaking down by that property.
This is useful for understanding entry URLs or UTMs. For example, to break down sessions by entry URL, click Property value and then select Entry URL.