Introducing HouseWatch: An open-source toolkit for ClickHouse
Jun 12, 2023


We are big fans of ClickHouse. We rely on it heavily to store and retrieve the massive amount of data we process every day. In doing this at scale for multiple years now, we’ve built a lot of expertise and systems related to ClickHouse.
To formalize and share these, we’ve recently built and launched HouseWatch, an open-source suite of tools for monitoring and managing ClickHouse. HouseWatch is free and works with your existing ClickHouse instance. You can clone it from GitHub and deploy it via Docker Compose.
Why we built HouseWatch
We started using ClickHouse in August 2021 when we moved away from Postgres.
ClickHouse provides tons of easily queryable metadata about your system, but knowing how and what to query is difficult. From our usage of ClickHouse, we’ve built an intuition for this – some of which we’ve documented in our ClickHouse manual.
We’ve also built many systems and processes for managing clusters. These include:
- Tracking metrics via Grafana
- Querying via Metabase
- Running operations on nodes through
ssh - Managing async migrations with custom-built tools
To share our expertise, formalize these tools, and centralize them in one place, our engineers Li, Yakko, and CTO Tim built the first version of HouseWatch at our Aruba offsite. We felt it would be useful to us, and support other ClickHouse users as well.
Features
HouseWatch provides a central location for the tools we use to monitor and manage ClickHouse.
Query performance and analysis
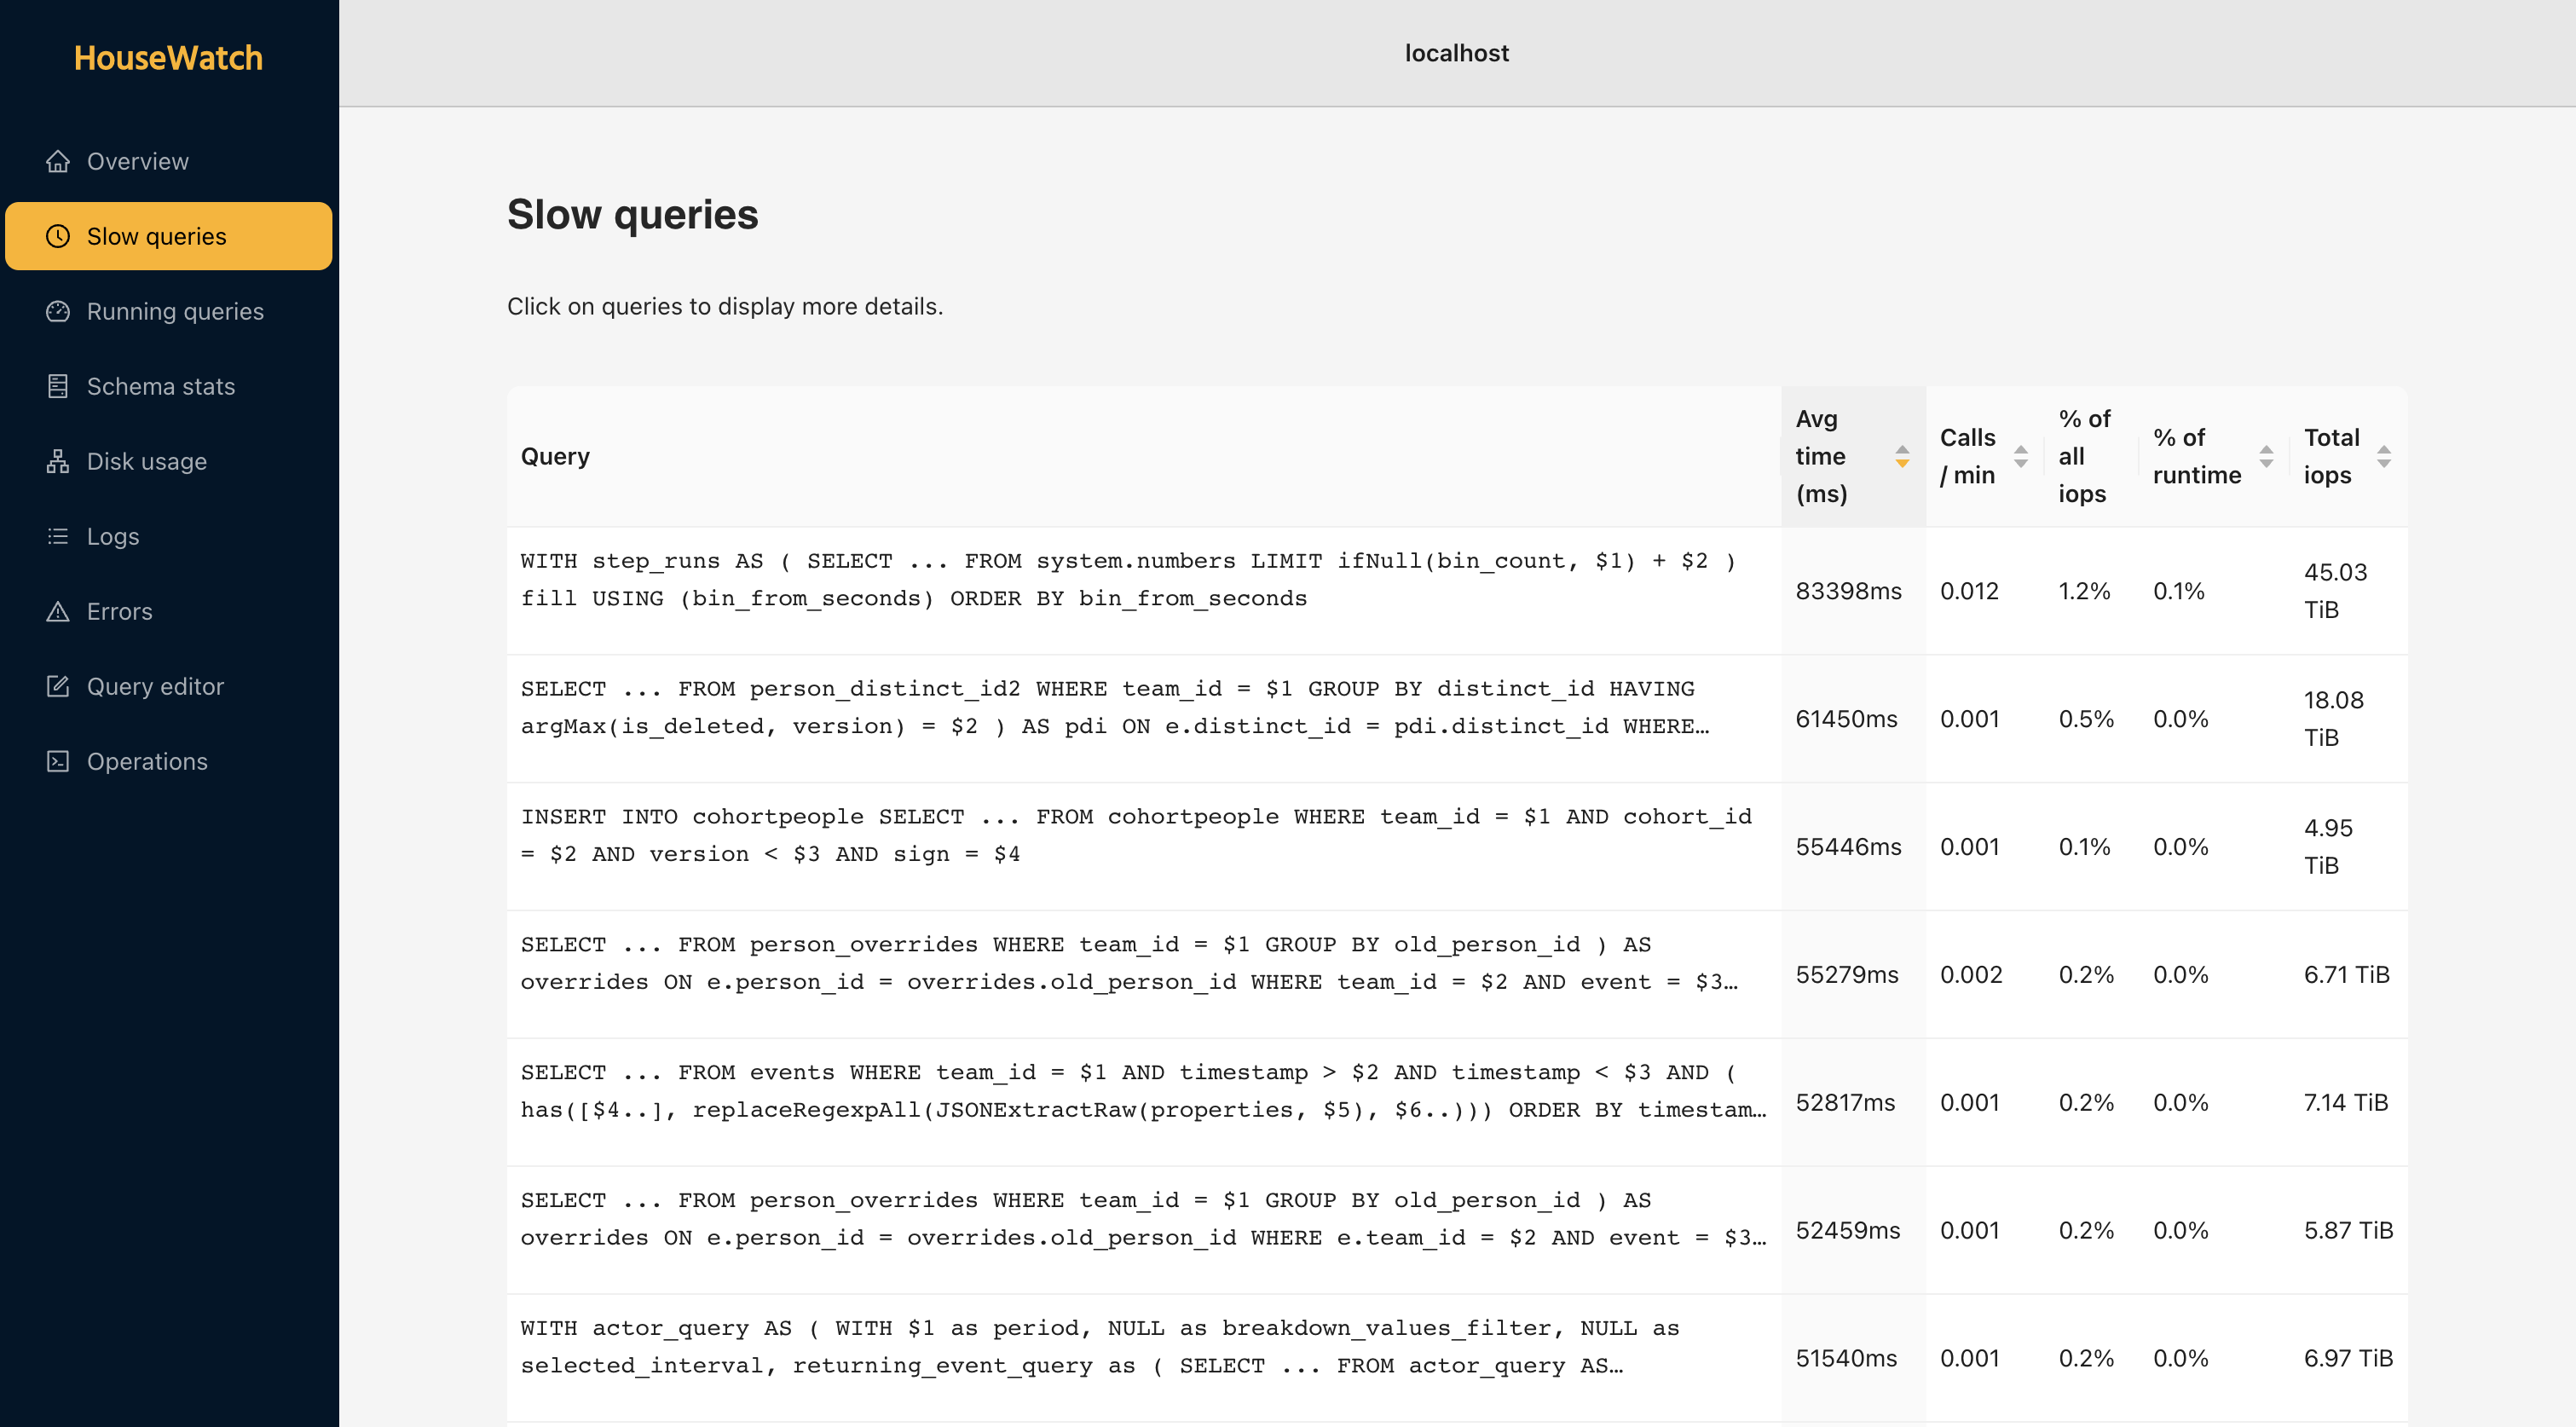
To help understand the performance of all the queries on your ClickHouse clusters, we provide a list of normalized queries and their performance metrics, with an emphasis on active and slow queries.
Each query includes metrics on average run time, calls per minute, percentage of all IOPs, total IOPs, and percentage of run time. It also includes details on the query itself and the EXPLAIN statement. From this, you can sort, monitor, and improve important, slow, or high-stress queries.
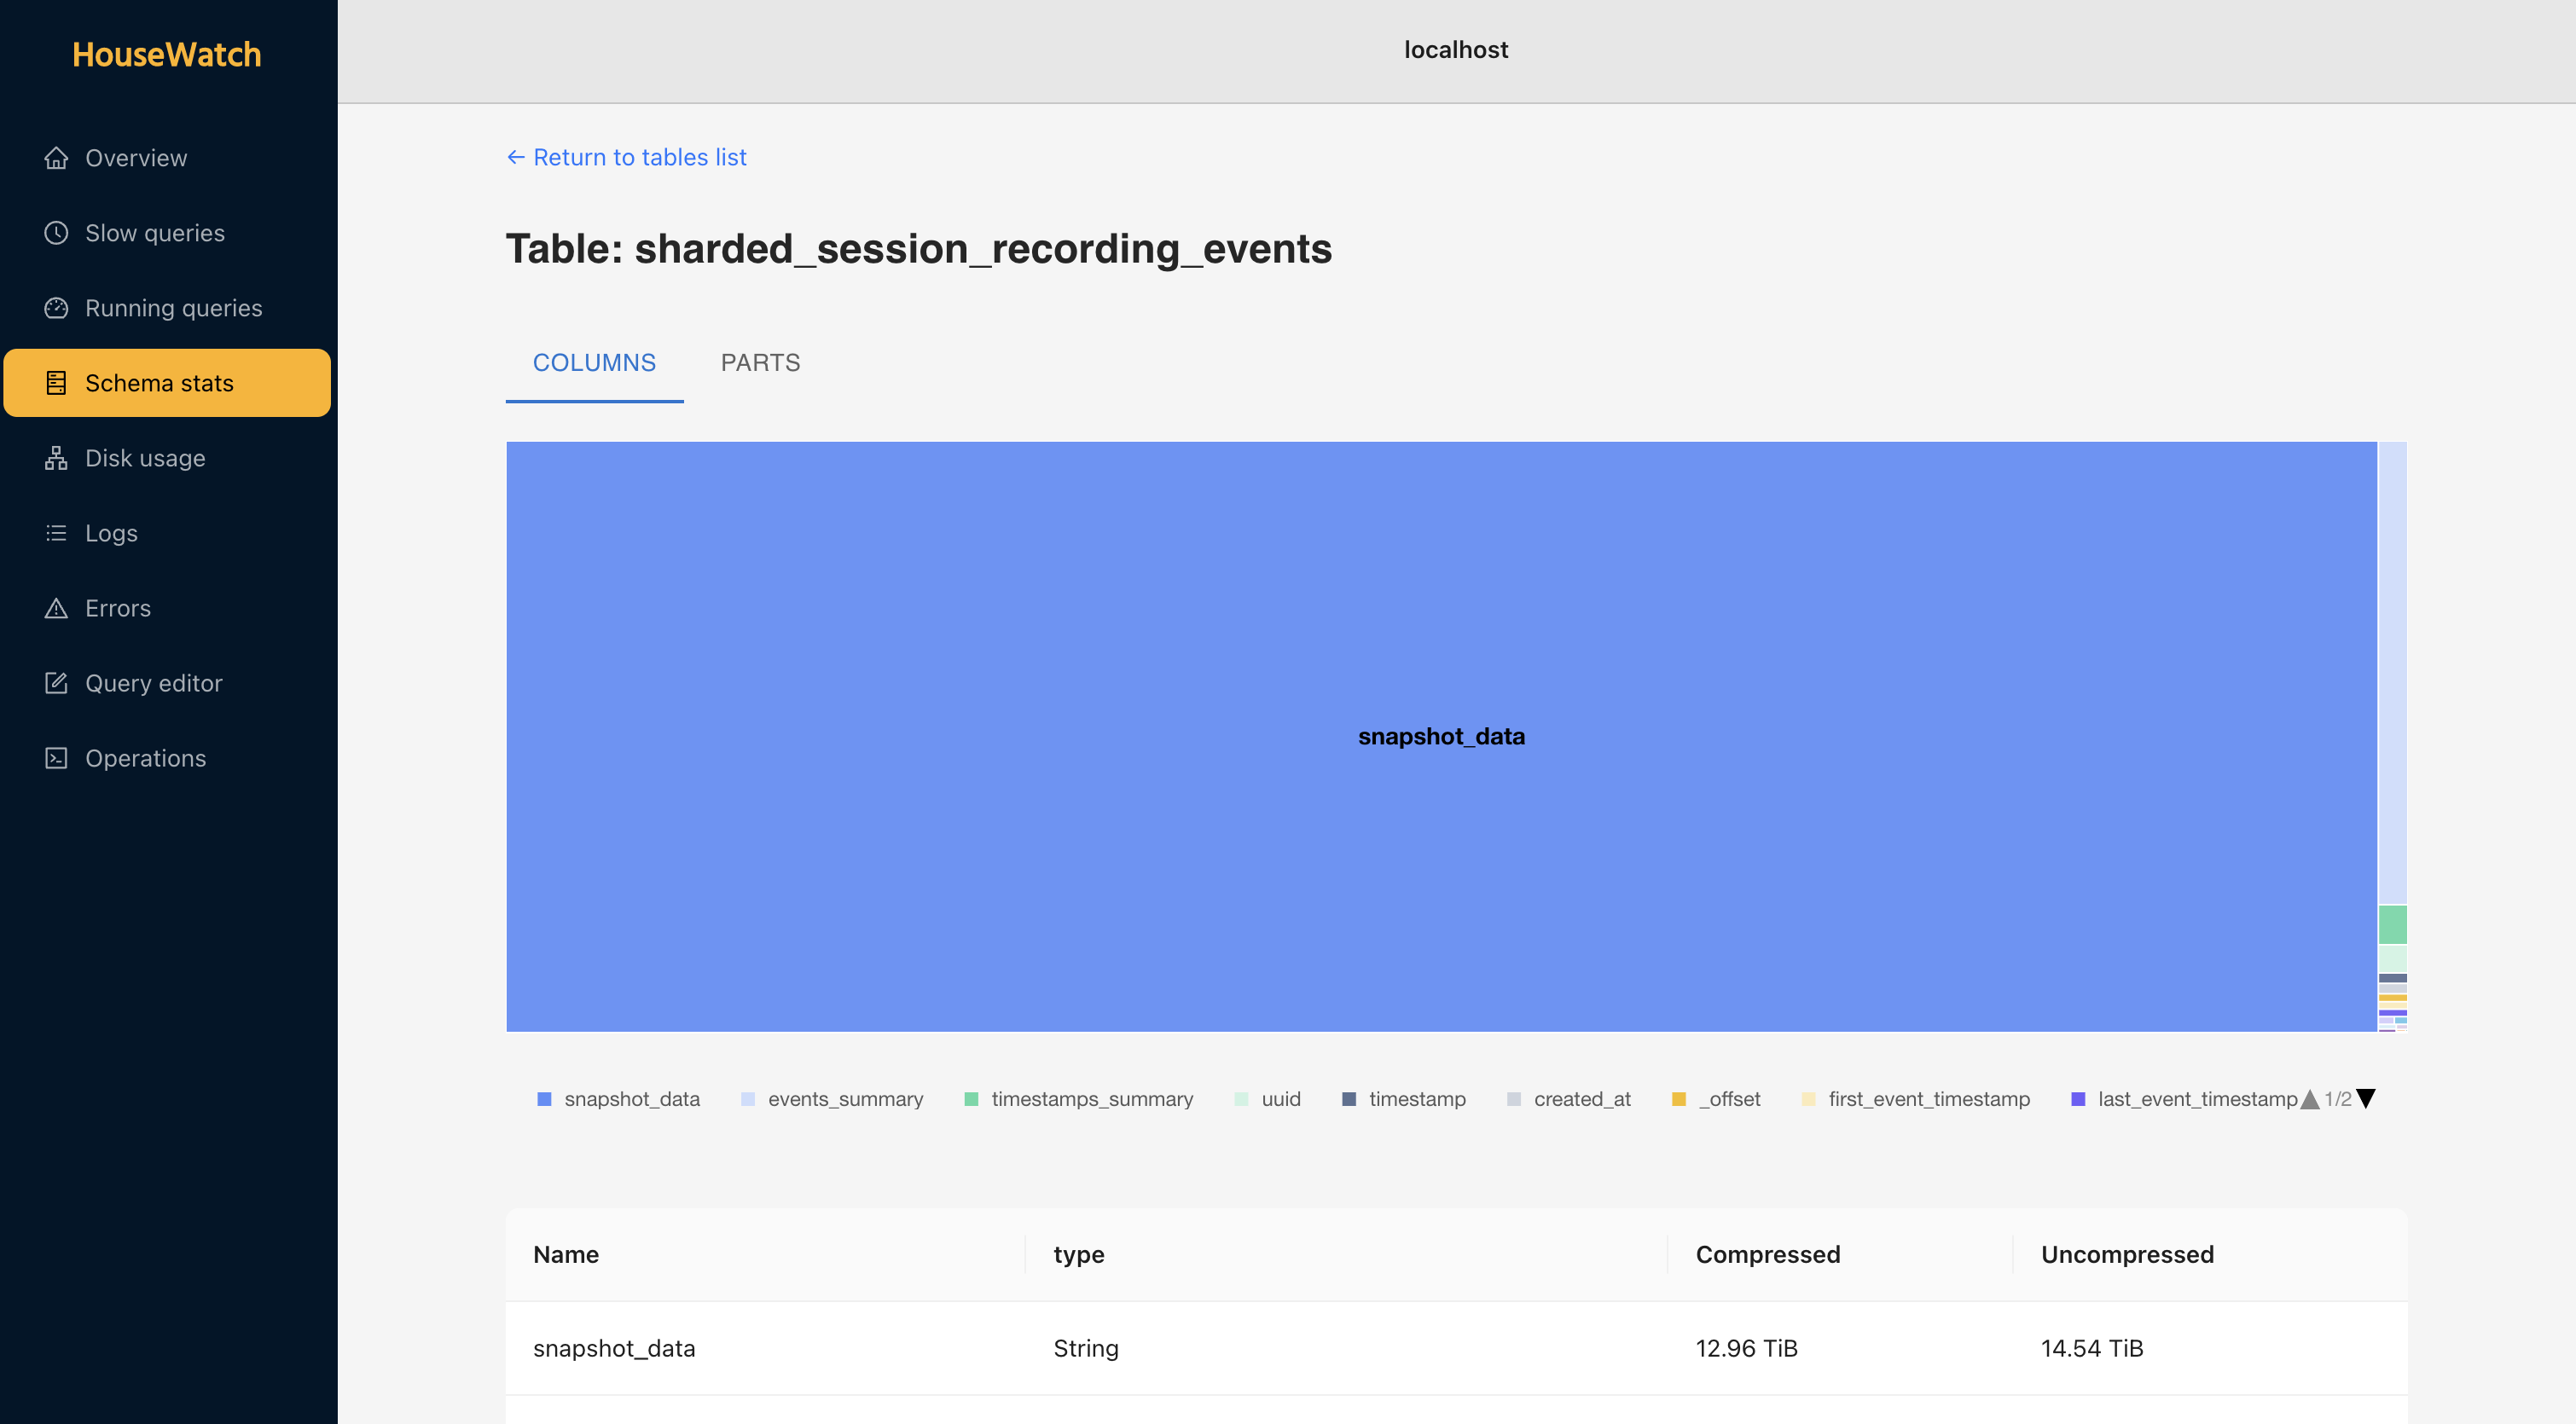
Schema stats
HouseWatch provides stats for all the tables for your cluster and lets you dive into the details for each of them. For each table, you can see columns, parts, compressed and uncompressed disk space sizes, disk usage, and more.
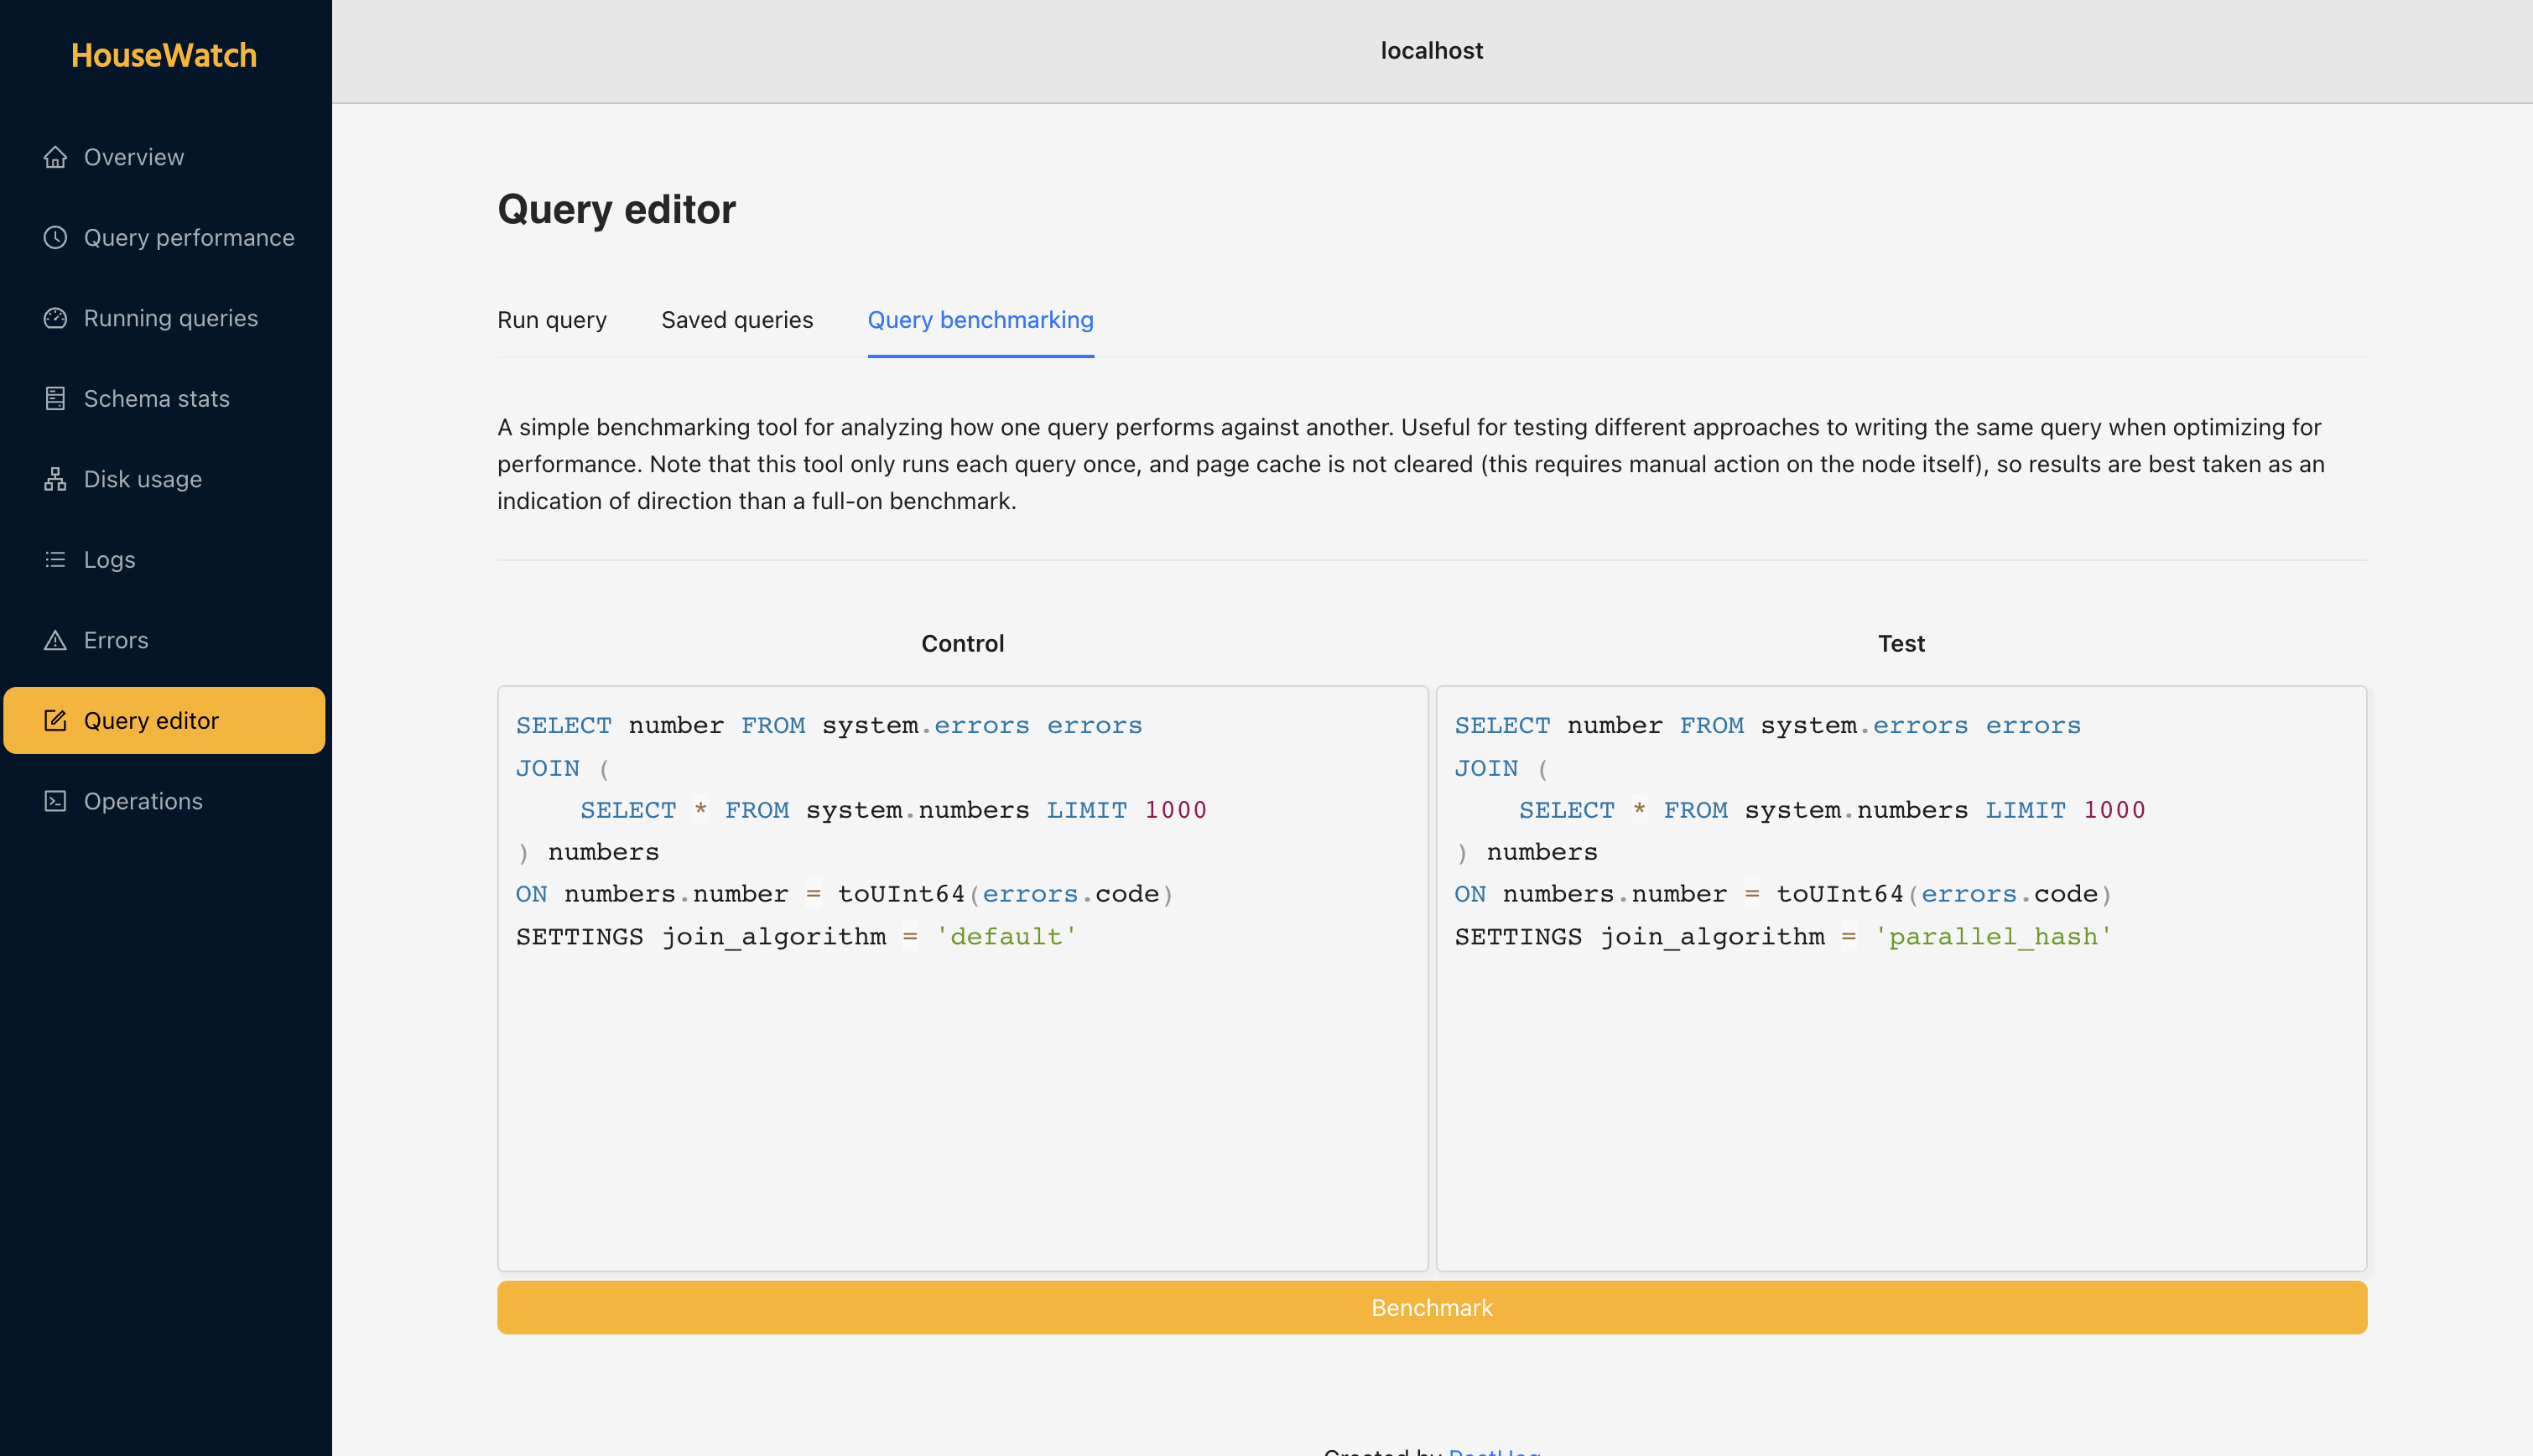
Query editing and benchmarking
With the size of data ClickHouse stores and processes, optimizing your queries is critical. To help you do this, you can run and edit queries in HouseWatch, as well as test and compare them.
You can run queries on your ClickHouse cluster and receive results visualized in HouseWatch. For query comparisons, you can write two queries, run them, and then get metrics on performance across the duration, read bytes, CPU usage, memory usage, and more.
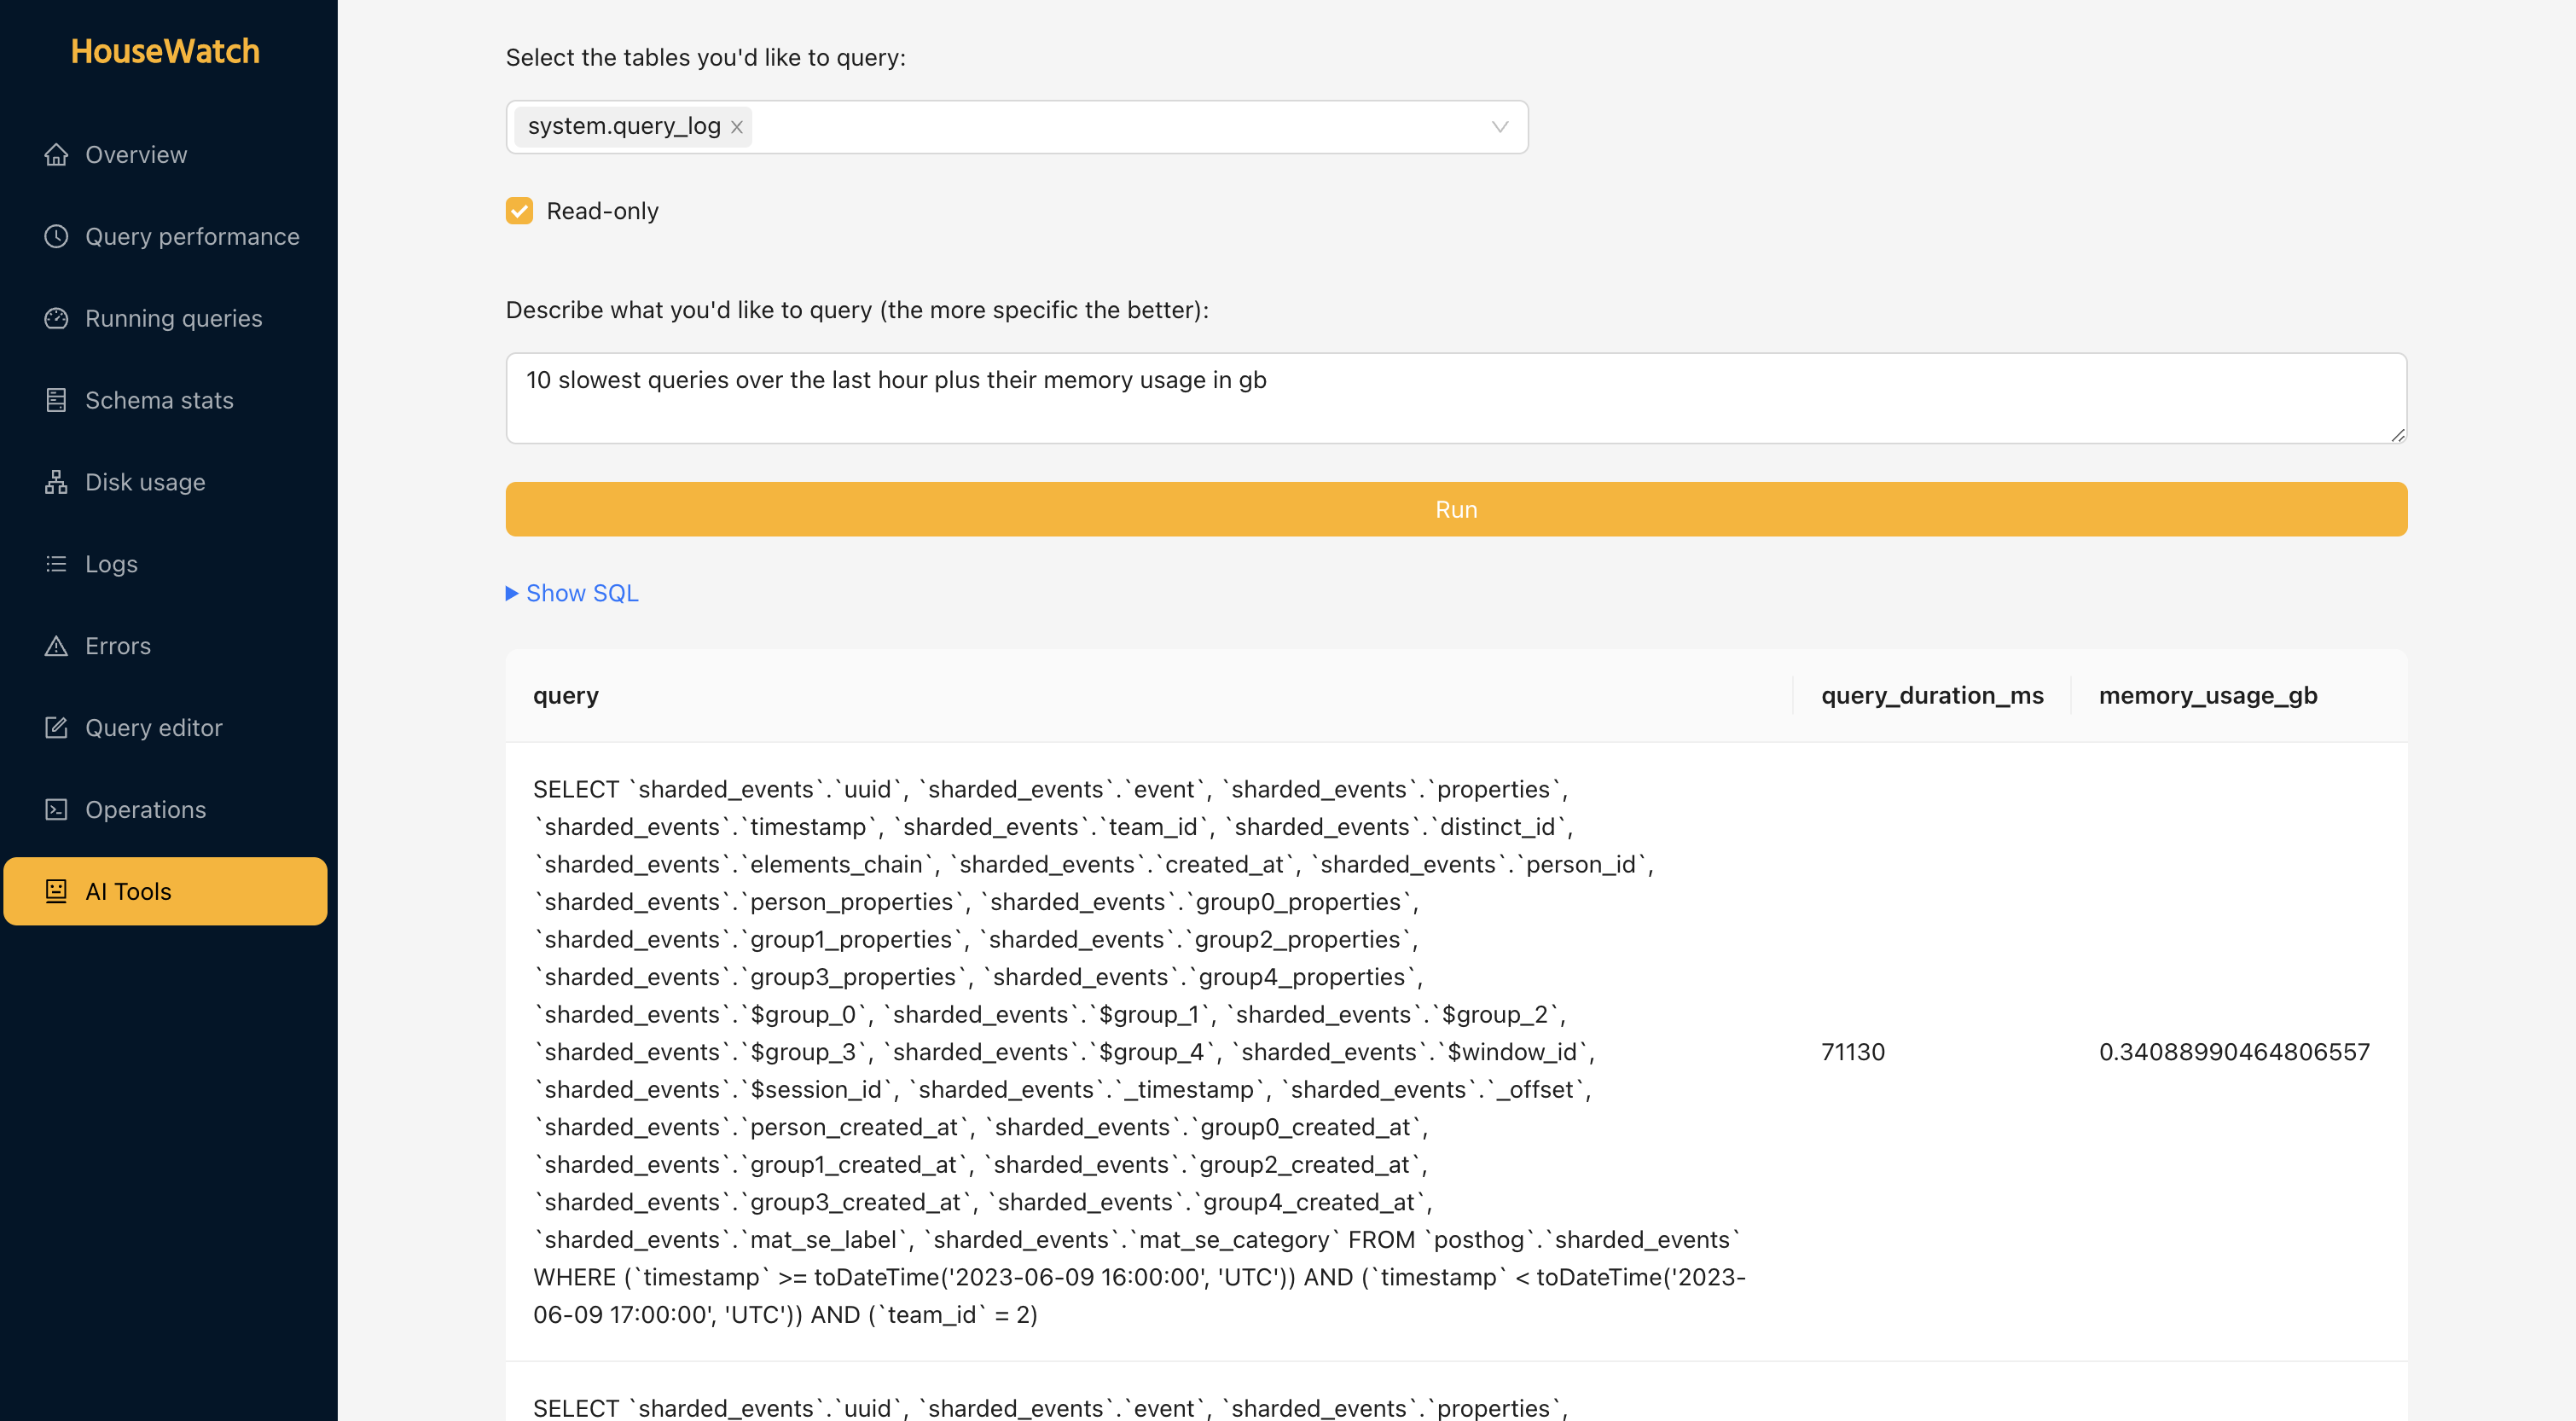
We’ve also built a natural language query editor that uses GPT to create ClickHouse queries based on the table and instructions you provide.
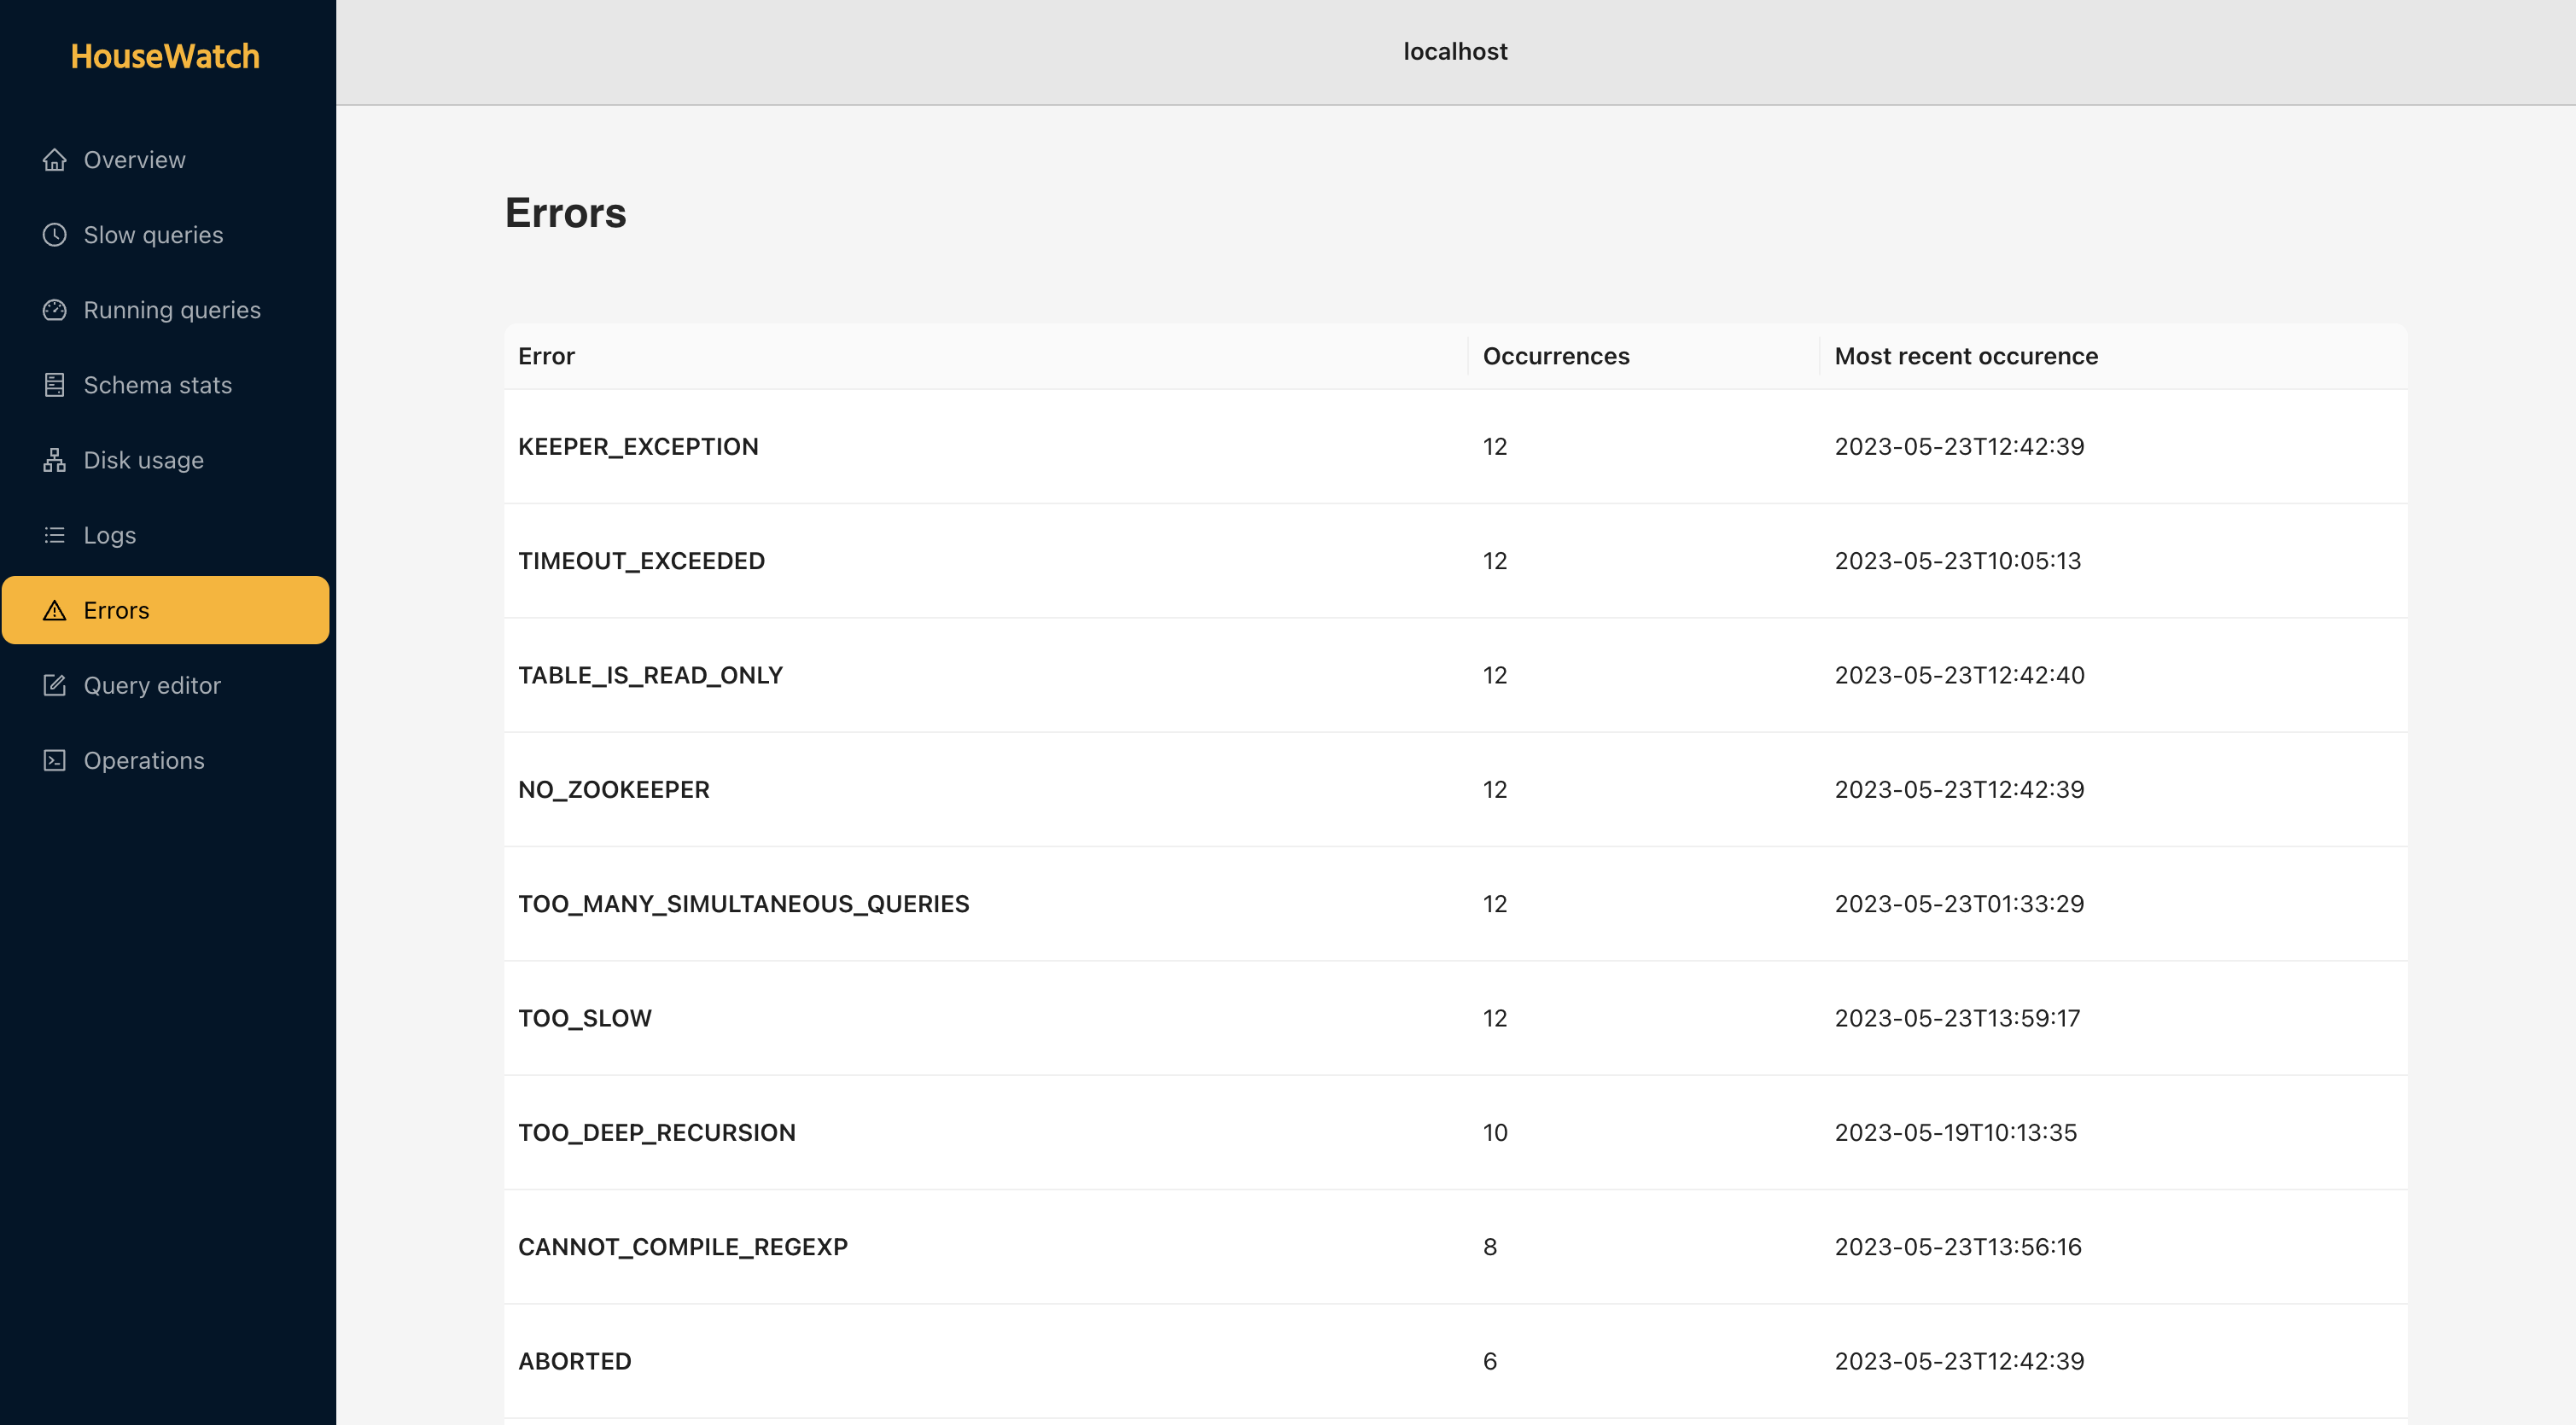
Logs and errors
Like any good monitoring tool, HouseWatch provides access to logs and errors from ClickHouse. For both, you can search for specific ones, as well as see the number of and most recent occurrences.
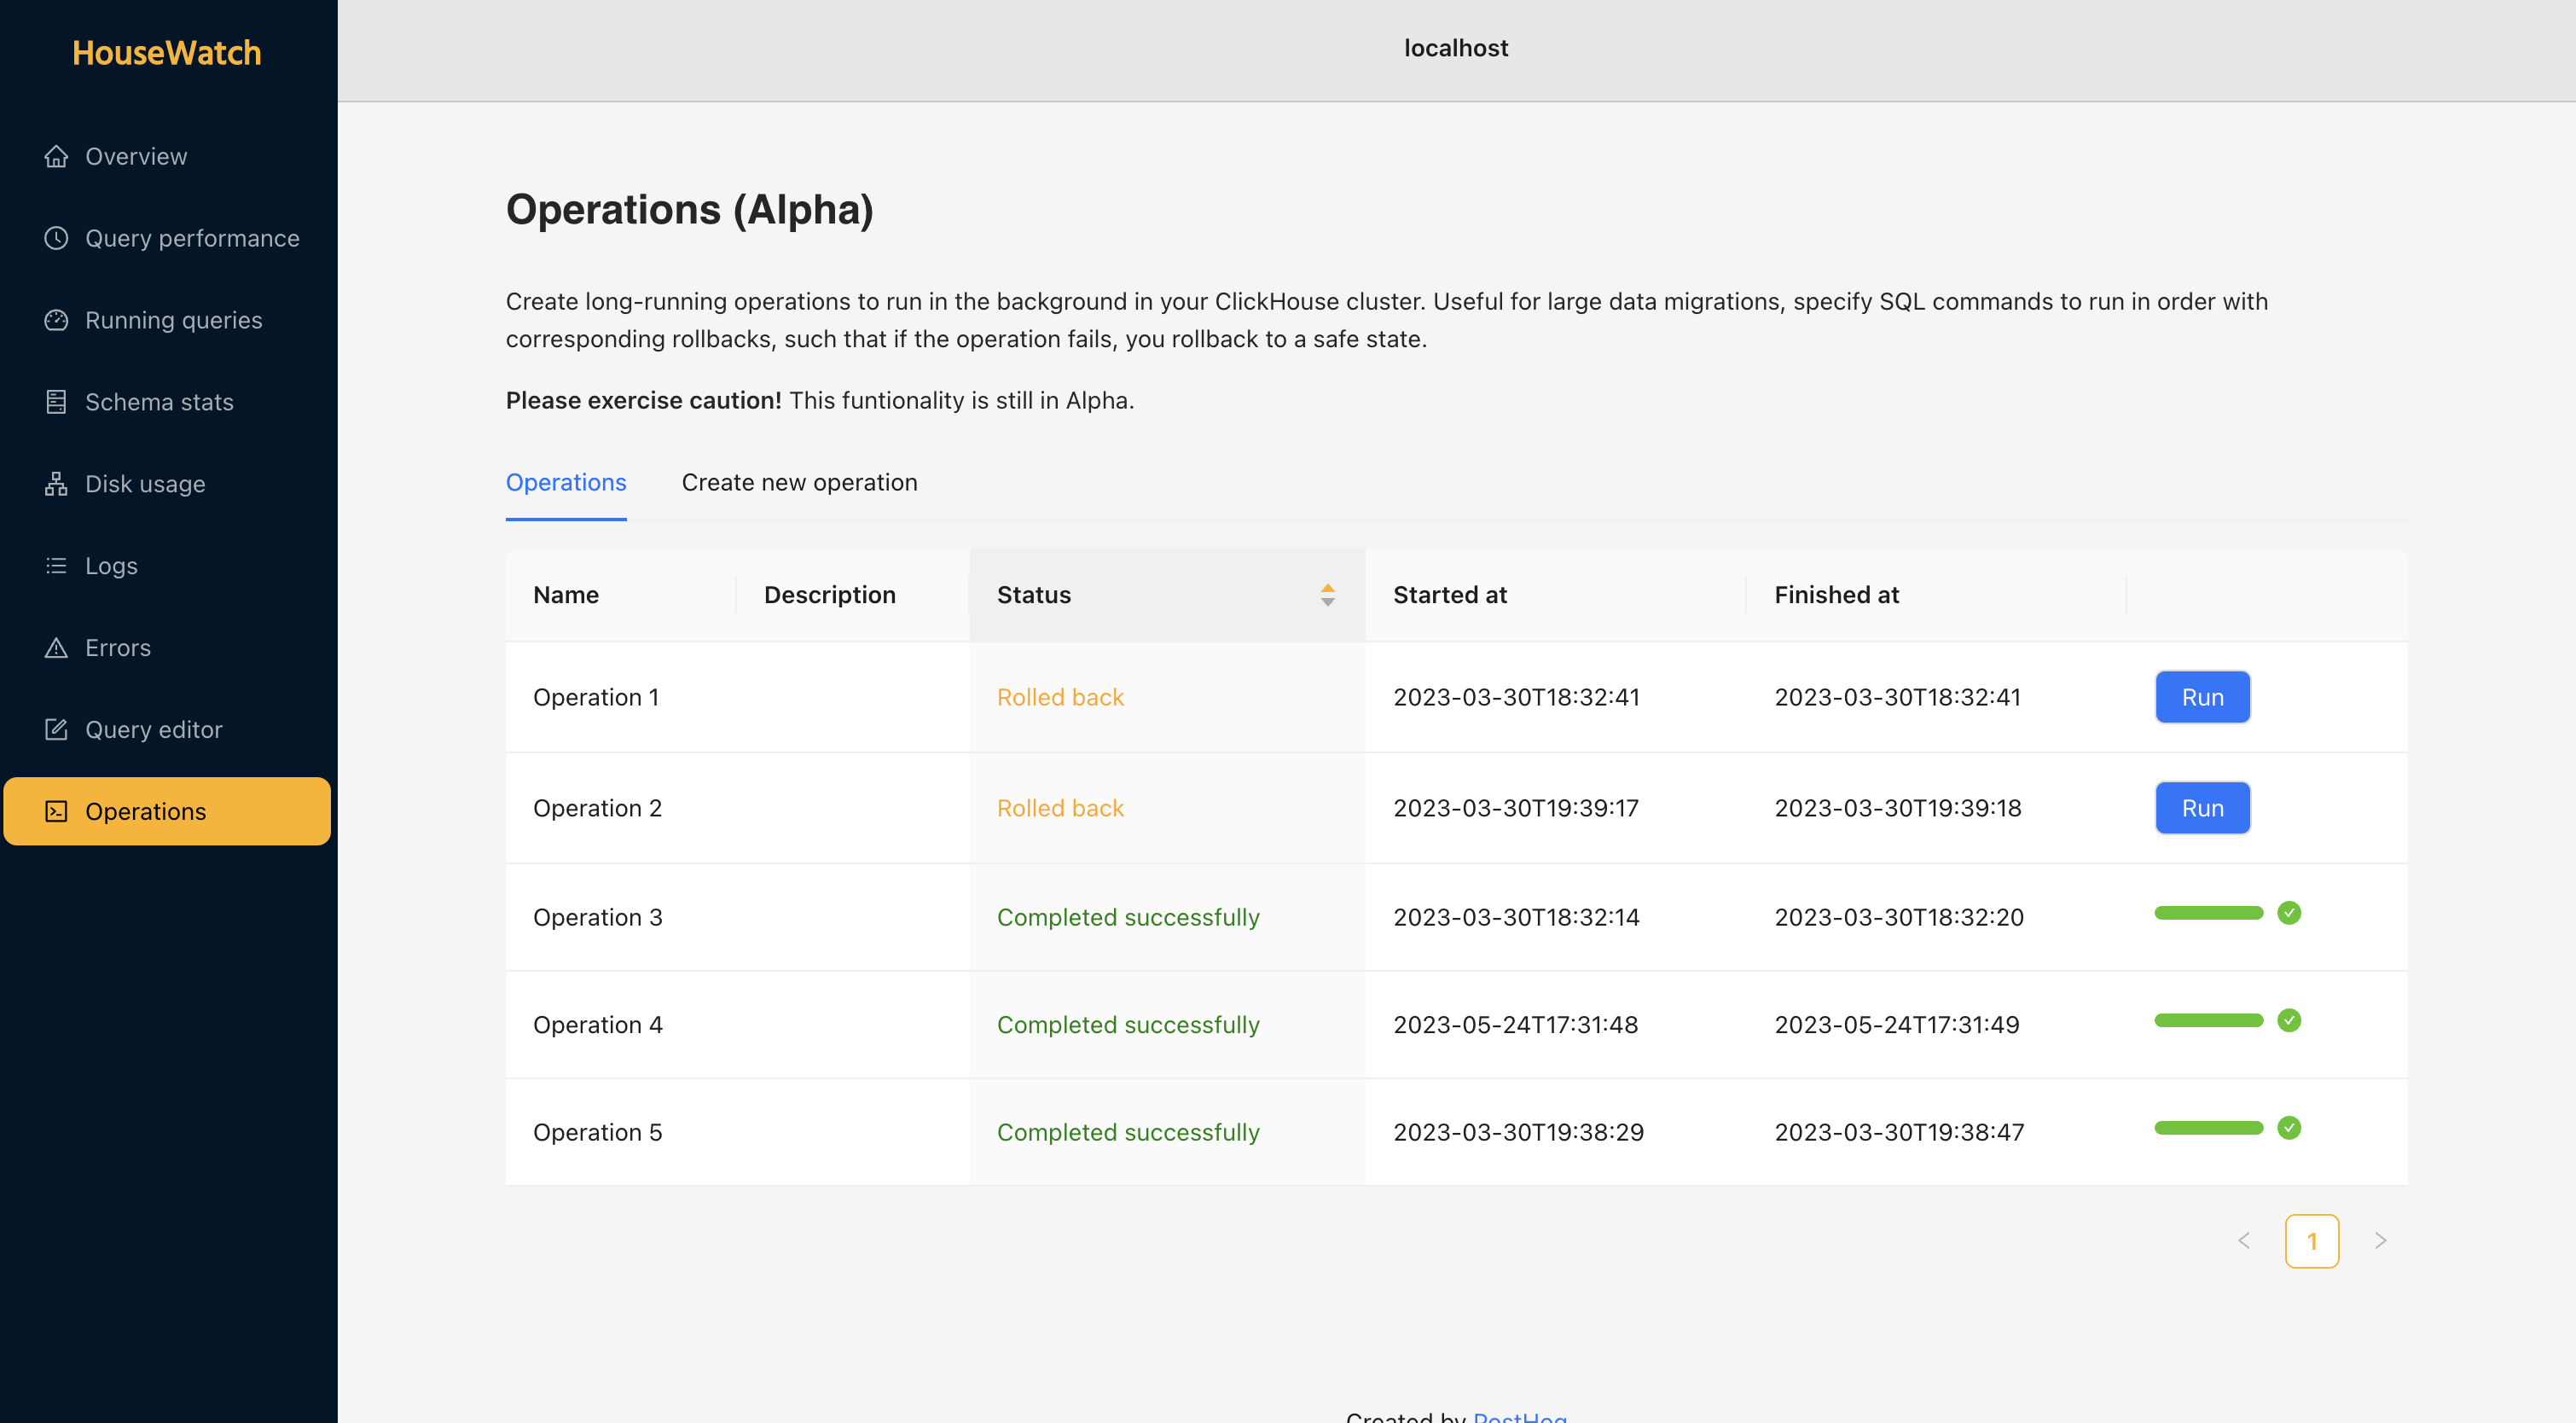
Operations
Last but not least is our operations tool. This is inspired by our async migrations tool, which we've used in production for over a year. It enables you to run and monitor long-running operations like migrations or SQL commands. You can monitor their status, pause or stop them, and retry them if they fail. Failures come with automatic rollbacks as well.
Deploying HouseWatch
First, clone the repo.
Next, create a .env file and add the following environment variables.
Finally, run Docker Compose.
Future plans
We aspire for HouseWatch to be like pganalyze for ClickHouse. There is more to build to make this a reality including:
- An index advisor tool
- A visualizer for
EXPLAINstatements - Support for monitoring multiple instances
- Automatic surfacing of known system issues
You can see our full to-do list, suggest a feature, find installation details, or contribute by going to the HouseWatch repo.